Abstract
Using data from the Carnegie Supernova Project that measures type Ia supernovae magnitudes over several days we developed models that fit the data (we call these models light curves). The models will help us determine the type Ia supernova intrinsic luminosity using Phillipsí relationship (Philips 1993). Since the intrinsic luminosity of these supernovae can be found they are called standard candles. What makes these supernovae extremely special is that they are used as a cosmological standard when measuring the expansion of the universe (Coelho 2014). We plotted the supernova in celestial coordinates to see if there are regions in the celestial sphere where these supernovae are more likely to occur. We also look to see what intrinsic luminosities are the most common for the supernovae.
Introduction
A supernova is a violent explosion of a star. These explosions are divided into type I and type II. There are three subtypes for type I (a, b, and c) (Coelho 2014). Type Ia supernova occurs in binary star systems where one of the stars is a white dwarf (Yoon 2004). The white dwarfís strong gravitational force strips mass from its partner star, and when the white dwarf accretes enough mass it collapses in on itself causing a supernova (Yoon 2004). Image to the right is an example of these supernovae. Not all Type Ia supernova have the same B magnitudes peak, but they have a similar luminosity-decline rate relationship that is related to their intrinsic luminosity (Phillips 1993).
Observations
The dataset must meet the following requirements: must observe a rise before the peak occurs and a model that fits the data. Since these requirements are to be met only 18 out of the 85 datasets of supernovae from the Carnegie Supernova Project were used (Figure 1 is an example of a light curve). The peaks are between 13 and 16, for each of the light curves (models) their following b, c, k, and σ parameters all have a distribution that indicates there isnít randomness among these parameters. They are bounded within a certain range such that they are close together. We have also noticed that when a lightcurve has an outlier in one of these parameters it also has an outlier in some of the other parameter. The decline of the light curves 15 days after the peak also differs with each individual curve, implying that the intrinsic luminosity is not the same for all the supernovae.
Results
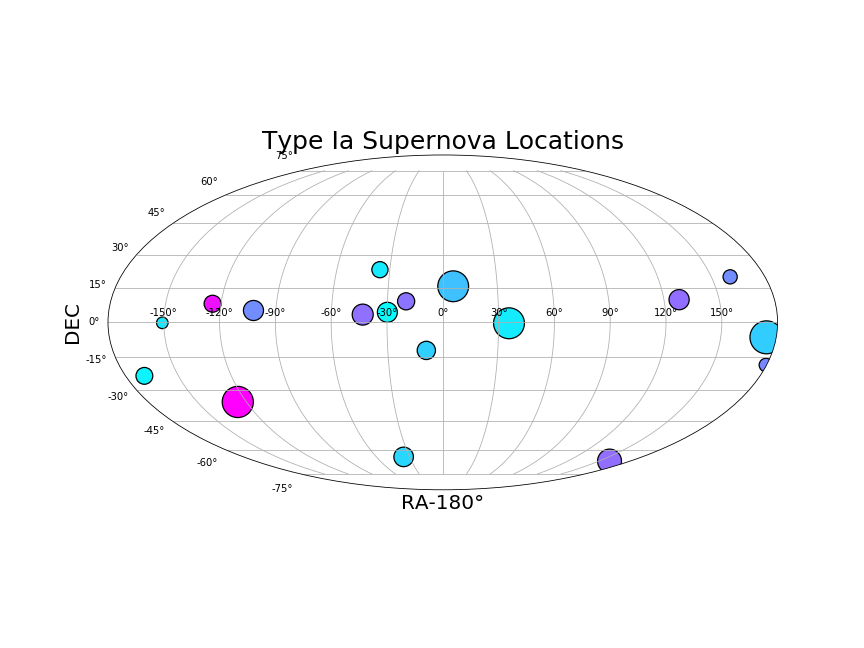
It becomes difficult to guess three of the parameters when the data has values of magnitude and shape that differs greatly across the datasets. However, with the 18 datasets, we have found interesting properties from their light curves. 15 days after the peak occurs if the decrease from the peak is steep, then the supernova would have a lower intrinsic luminosity, as is expected from Phillipsí relationship (Phillips 1993). There is also a limits for the values of 0.8≤∆m15(B)≤1.8, m15(B) is in B band magnitude meaning that the limit for the absolute values of the intrinsic luminosity are between -19.4 magnitude and -16.9 magnitude. From the 18 supernovae that are used, many of these supernovae occur along the celestial equator, (where the declination is 0∞). However, the supernovae are not "bounded" or preferred to occur in any right ascension values. There is no common, or "normal" intrinsic luminosity for Type Ia supernae, their luminosities vary.
Future Plans
We are looking for other methods to optimize the finding the supernova's light curves. We are planning to use the Jones et al. Supernova Catalog from the Barbara A. Mikulski Archive for Space Telescopes (MAST). This catalog has over a thousand supernovae. We are looking to see where these supernovae are likely to occur using the Jones data. Also planning to look at the properties that supernova have. Do the supernova properties vary depending on their locations. We are also planning to compare the intrinsic luminosities computed from the Phillipsí relationship tothe intrinsic luminosity computed from the stretch factor.
Appendix
This GitHub repository has all the codes that we have worked with.
Click here to find a tar file from the Carnegie Supernova project that was used in our research.
 "
"