Background
I was a member of Dr. Jonelle Walsh's research group in the TAMU Department of Physics and Astronomy from January 2017 to June 2019. The main focus of this group is to study the relationship(s) of supermassive black holes (SMBH) with their host galaxies. In particular, I have been working with Dr. Walsh and a fellow undergraduate in the group to measure the mass of the SMBH within the galaxy NGC 4203 using both the stellar and gaseous kinematics of the galaxy. Usually the mass of a SMBH can only be measured using one of these two methods. This makes our project especially interesting, because upon completion we will be able to directly compare the outcomes of the methods.
Measuring Stellar Kinematics
We use the penalized pixel-fitting method (pPXF) to measure the stellar kinematics of the galaxy. Long slit spectroscopy data of NGC 4203 from the LRIS instrument at KECK Observatory, a library of stellar template spectra, and input parameters such as bias and additive/multiplicative polynomials, are all fed into pPXF over a specified wavelength range (the calcium II triplet range in our case). Each template star in the library has information in addition to a spectra, such as stellar classification type. Both galaxy and template star spectra are logarithmically rebinned by pPXF so that they can be compared via redshift, and the stellar population of the galaxy is deciphered. Using the above information, pPXF returns kinematics and a best fit model of the galaxy data. An initial best fit model that we generated using pPXF is shown in Fig. 1.
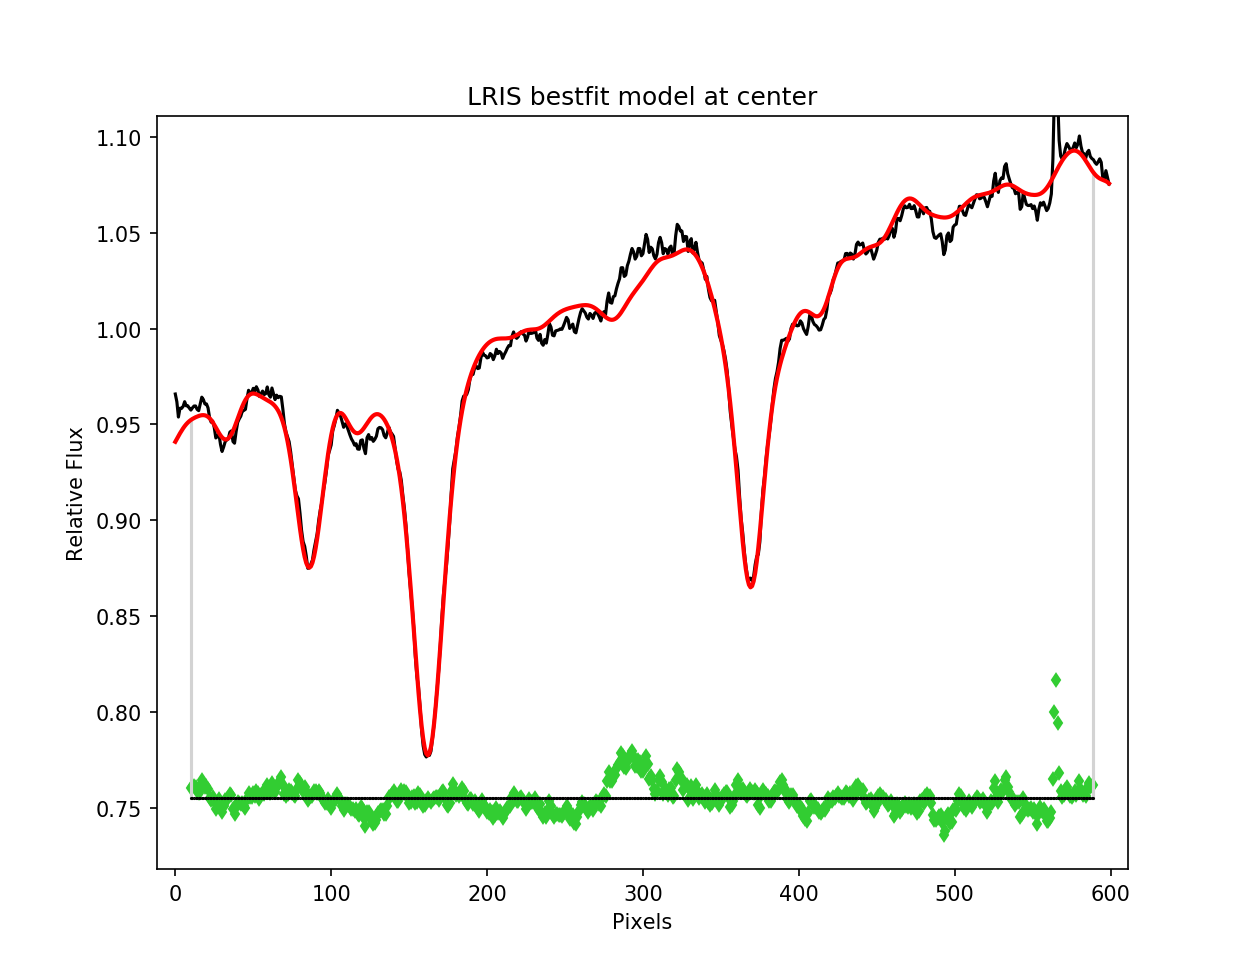
In order to hone in on more accurate input parameters, we've also run Monte Carlo simulations based on this fit. Using the standard deviation of the residuals, we add random Gaussian noise to the model and pass a new synthetic spectra to pPXF for 300 iterations and evaluate the error in pPXF's analysis. In other words, the more similar to the galaxy spectra the Monte Carlo fits are, the better our initial best fit.
The galaxy spectra is in 2D with rows and columns that describe the flux values. (Imagine a horizontal white strip -the galaxy- on a black background.) We found the center row of our data, where the galaxy spans the image, by fitting Gaussians to each column of data and taking the average of each of their centers. After that, we binned rows of the 2D galaxy spectra based on their signal to noise ratio (S/N). Starting from the center row and moving out in either direction, we binned based on a S/N of at least 40. Rows near the center are where the galaxy is and consequently tend to have a high S/N, so the binning mostly effects rows along the edges of the data. Using the binned rows, we ran another Monte Carlo and used the results to plot stellar kinematics, shown in Fig. 2.
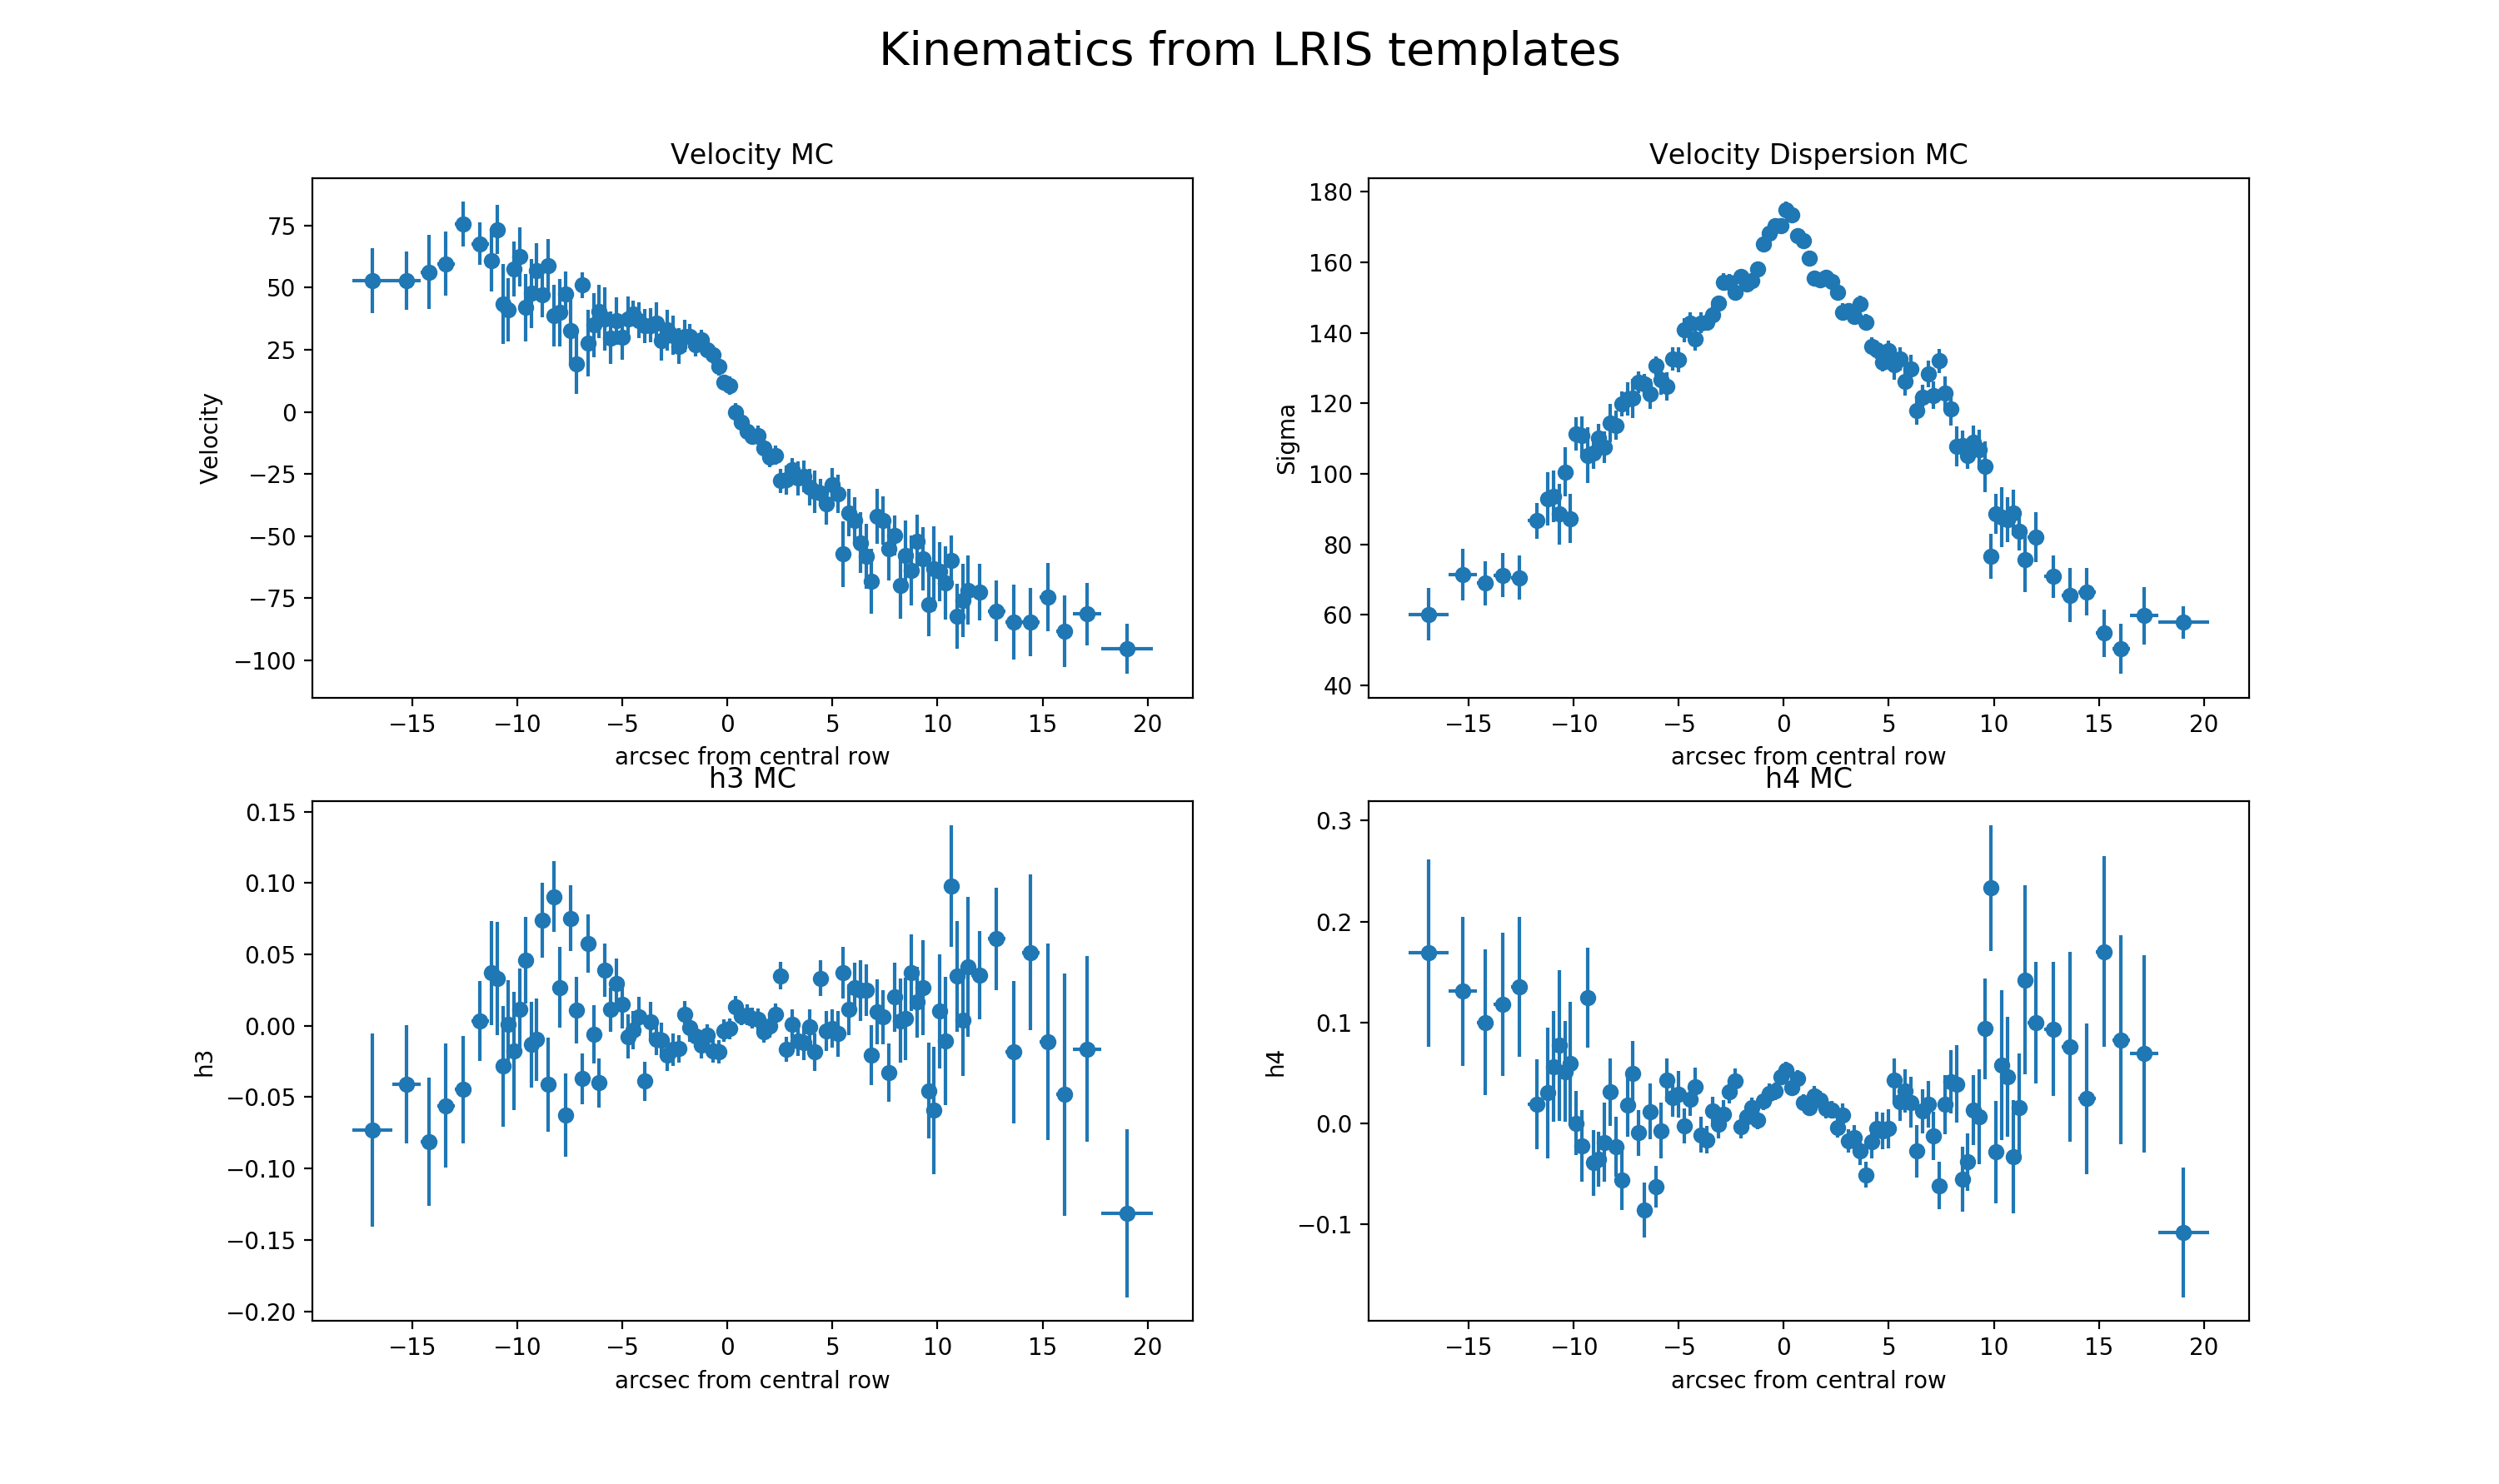
We repeated a similar process for two more template libraries, each with many more template stars than the initial eight from LRIS, to get more fits to compare to. Currently, the kinematics we get from the three different libraries do not match and we are investigating why this is before moving to next steps.
Background Photo Credit: M87 SMBH shadow