The X-Ray Afterglows of Short Gamma Ray Bursts
CIERA REU 2020 - Mentors: Kerry Paterson, Alicia Rouco Escorial, Wen-fai Fong
Background
Gamma-ray bursts (GRBs) are short, powerful bursts of radiation that are first detected in the gamma-ray band, followed by an afterglow that can be detected in longer wavelengths. GRBs can be sorted into two groups: long GRBs, with a duration of 2s or longer; and short GRBs (sGRBs), lasting less than 2s (D'Avanzo 2015). X-ray afterglows, lasting on the order of 103s, have been detected for many bursts with the Neil Gehrels Swift Observatory (Swift). These light curves from are hosted online in the Swift/XRT GRB Catalog (Evans et al. 2007, 2009). The light curves hosted on the catalog are automatically fit with power-law models ranging from a simple, unbroken power-law to a broken power-law with up to five breaks. The process they use to fit the light curves is discussed in detail in Evans et al. (2009). Although the light curves of the afterglows from many sGRBs follow a typical power-law decay, some of the afterglows have much more unusual light curves. It is not yet understood what causes these unusual afterglows. We identified two types of these unusual light curves—those with an unusually steep decay, and those with a plateau—and looked at their properties, including the duration (T90), flux, fluence, and hardness, to begin to understand what makes these bursts different.
Fitting the light curves
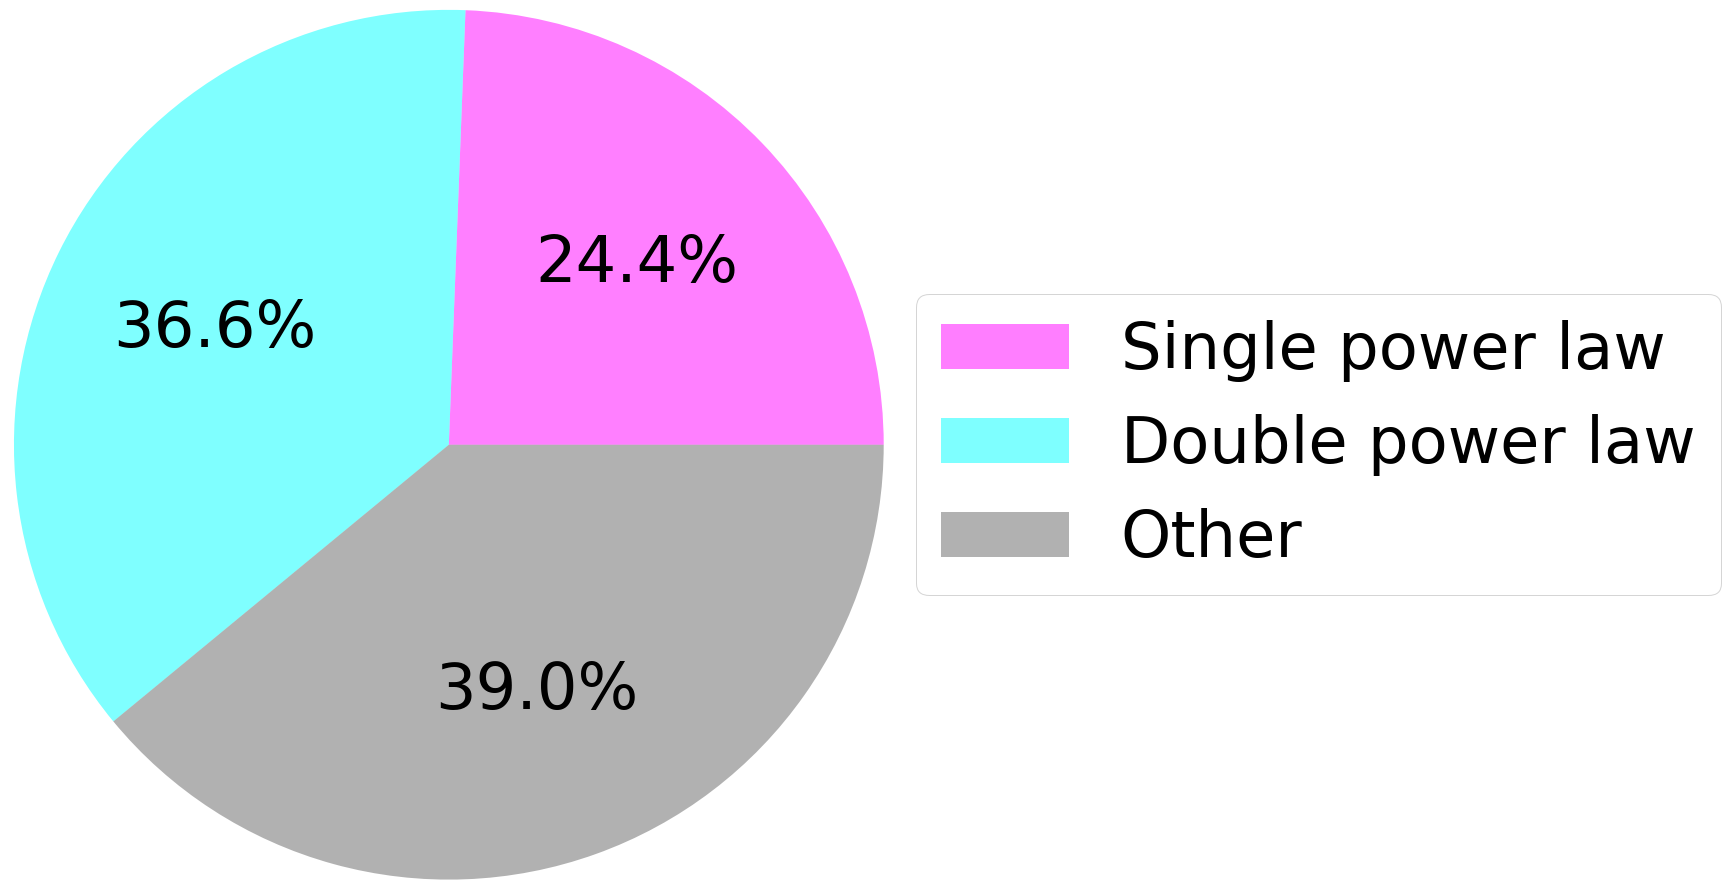
Light curves of the X-ray afterglows from 81 sGRBs, from 2005 to 2018, were obtained from the Swift/XRT catalog (Evans et al. 2007). The light curves were fit with single power-law (SPL) and double power-law (DPL) models using the emcee library in Python. These bursts were then sorted into three groups: bursts well fit by a single power-law, bursts well fit by a double power-law, and bursts not well fit by either to look at in more detail. This sorting was initially accomplished with a χ2 cutoff, and then confirmed by eye and compared with the Swift catalog. Of the 81 bursts we had light curves for, 20 were well fit by a single power-law, 30 were well fit by a double power-law, 14 were not well fit by either, and 17 had too few data points to be fit. Figure 1 shows this distribution, with bursts not well fit by either SPL or DPL and bursts with too few points to fit all grouped together in "other".
Identifying unusual bursts
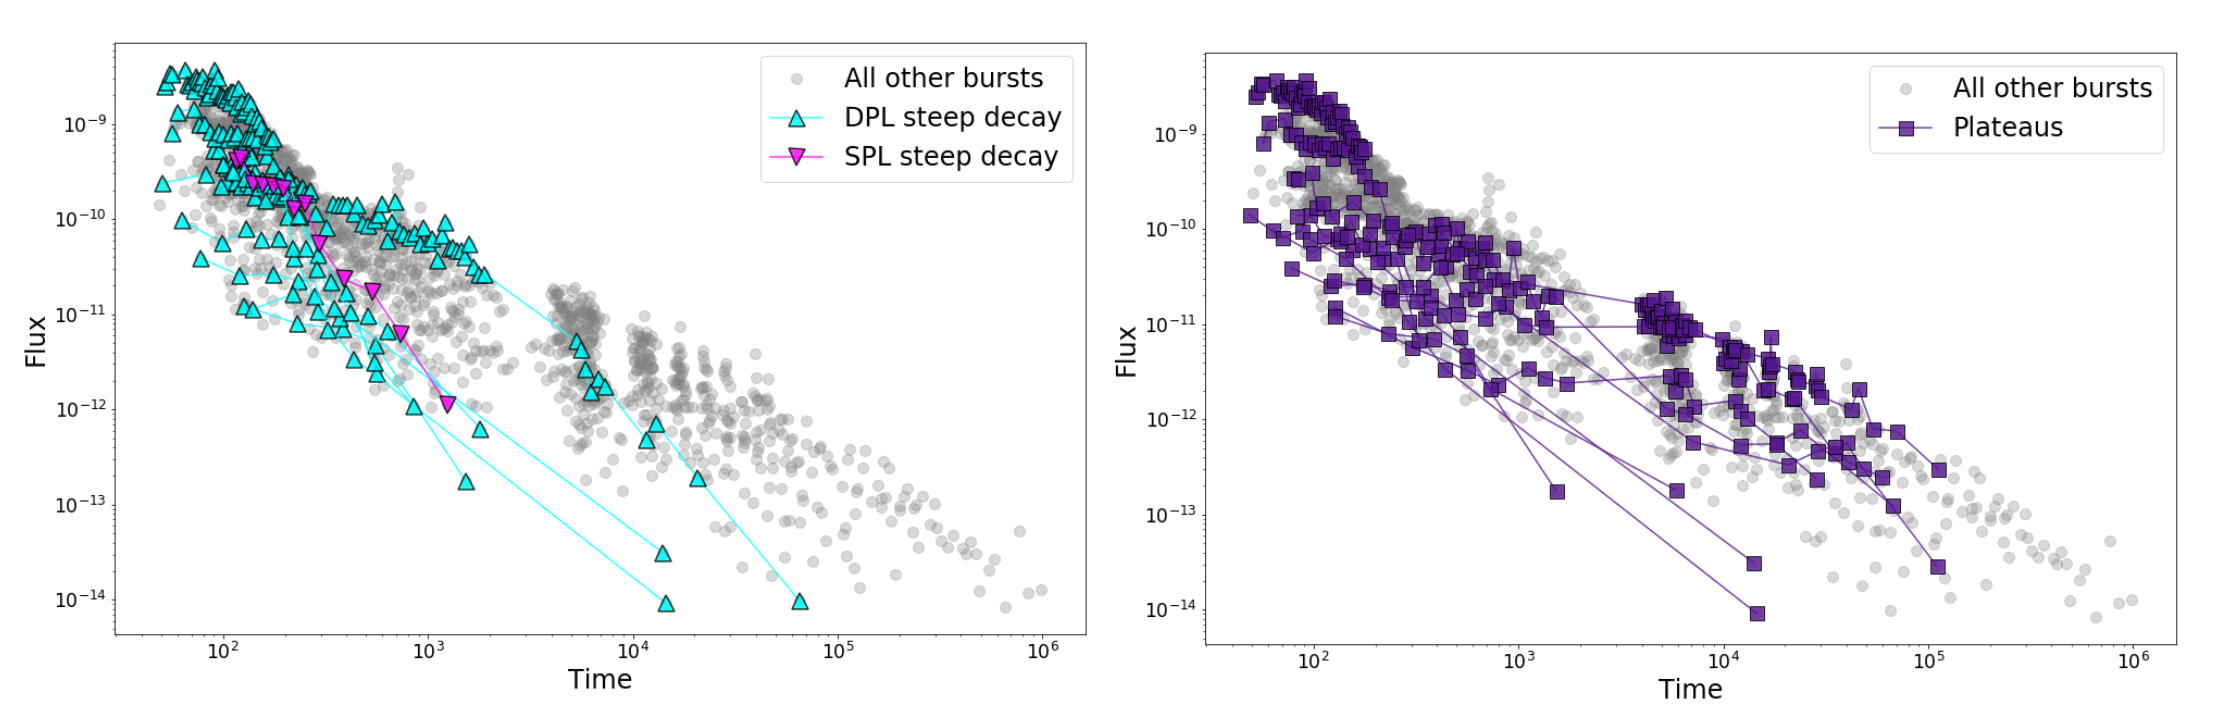
Based on the decay index (α), filters were applied to the SPL and DPL groups to look for two types of sGRBs with unusual light curves. The first are bursts with a very steep decay, characterized by an α (for a single power law) or α2 (for a double power law) value less than -2. The second group is bursts whose light curves show a plateau, which would show up in a double power law with α1 or α2 very close to 0 (we used -0.5 ≤ α ≤ 0.5). These filters were not applied to the bursts that were not fit well by either a single or double power law; further work will be required to investigate these bursts. When the filters for steep decay and plateaus were applied, we found 1 SPL burst with a steep decay, 9 DPL bursts with a steep decay, and 11 DPL bursts with a plateau. 5 DPL bursts had both a plateau and steep decay.
Investigating burst properties
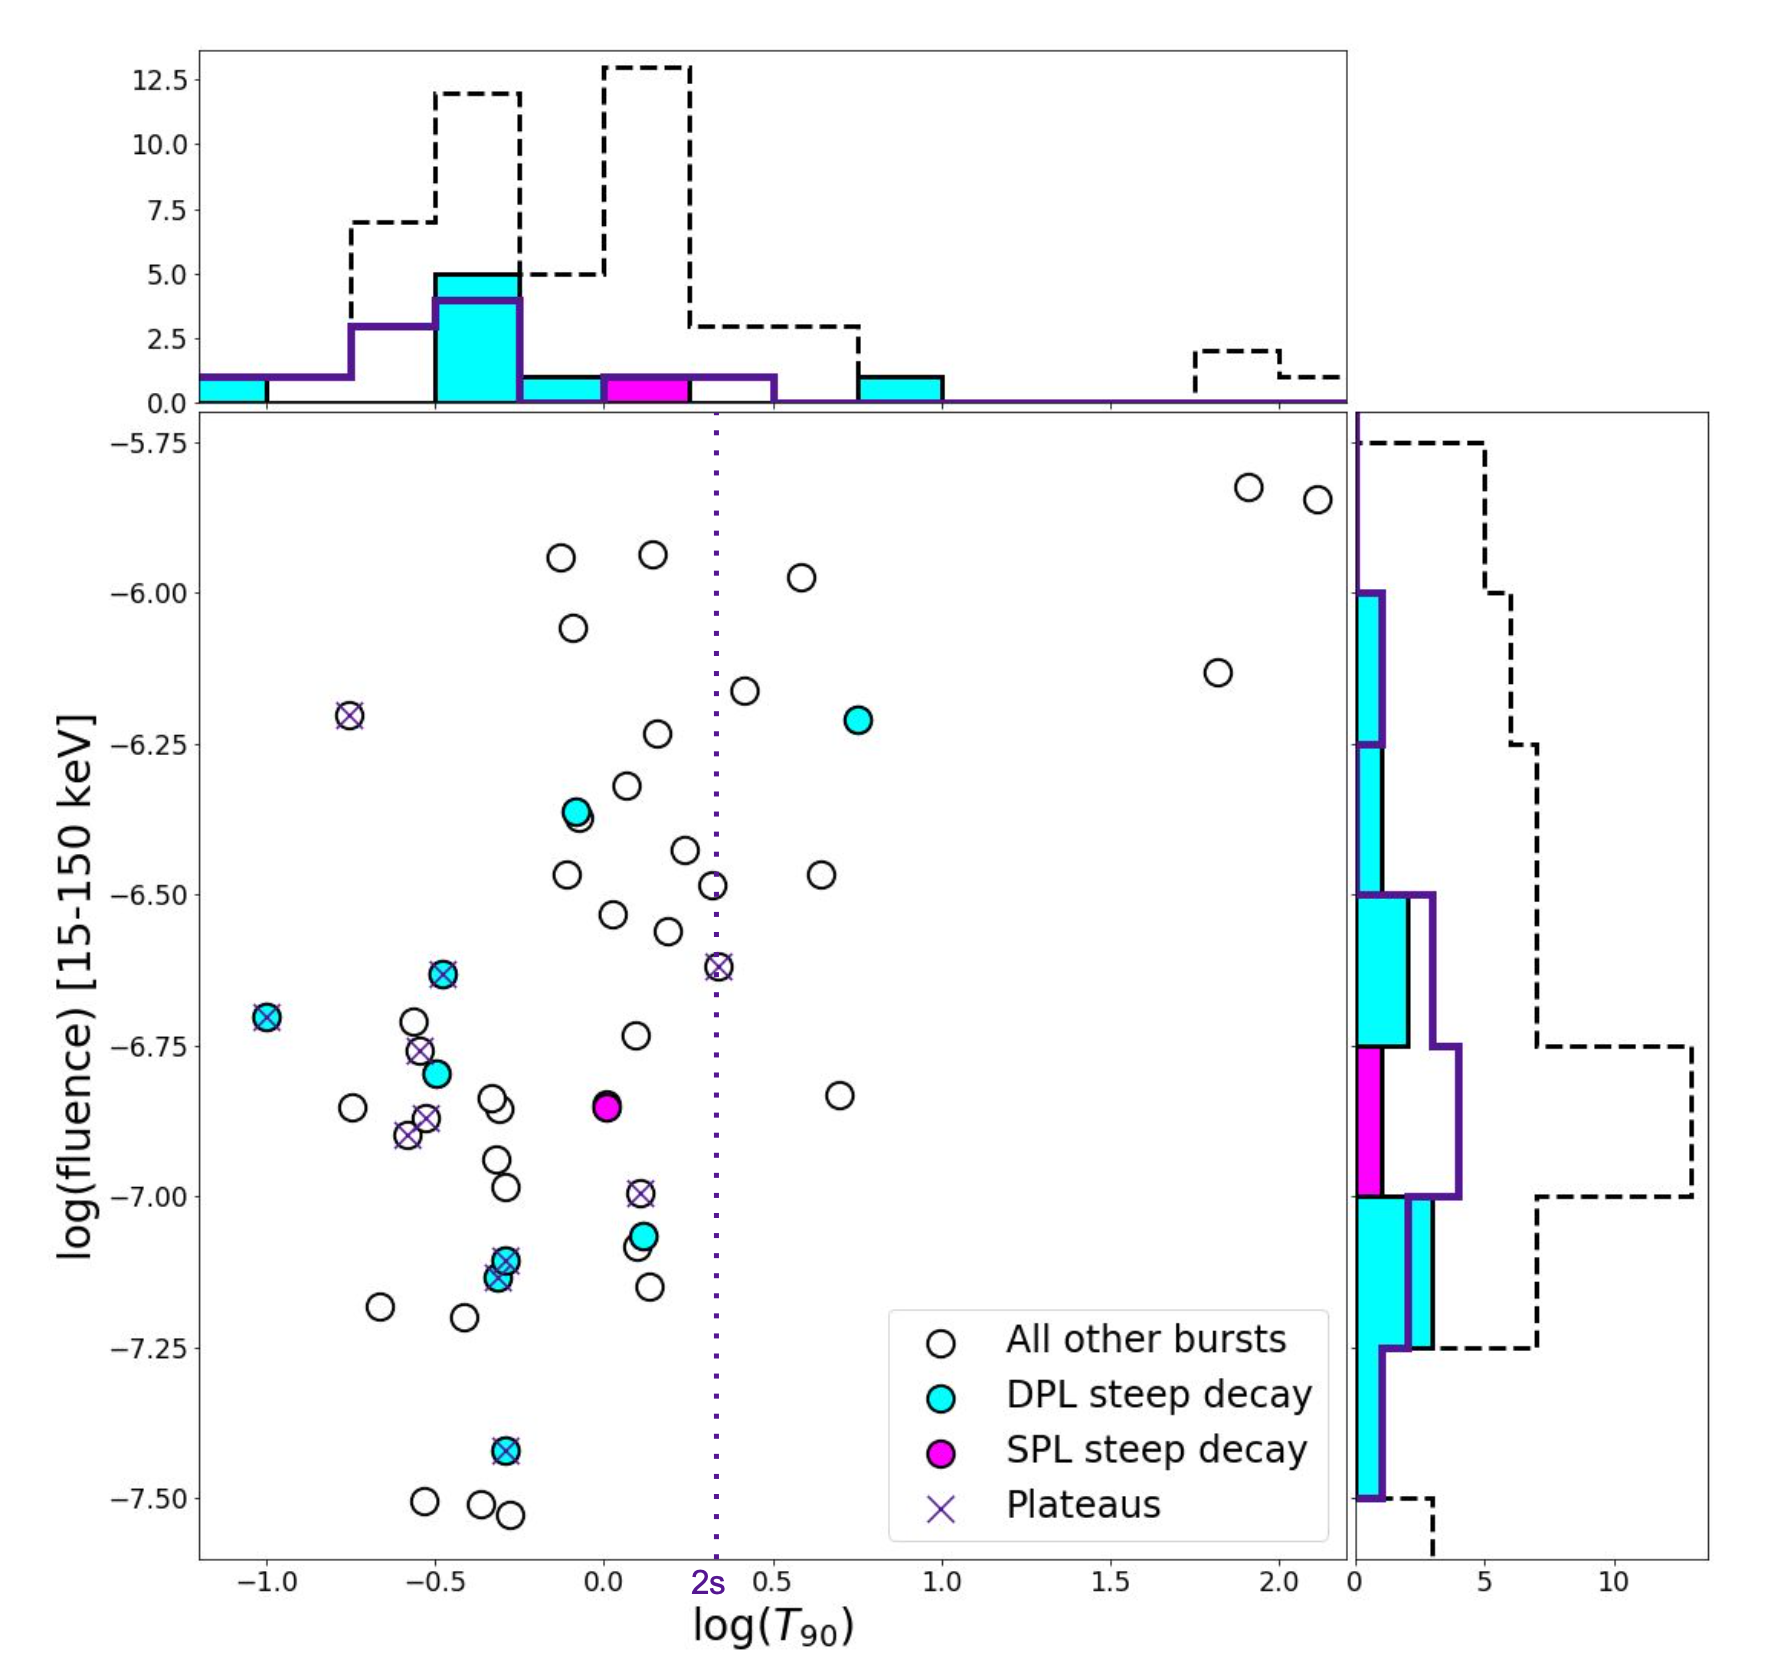
After identifying the bursts with steep decay or plateaus, we then compared the parameters of these bursts to those of the other, more typical bursts. Looking at T90 (duration), flux (15-150 keV), fluence (15-150 keV), and hardness (fluence from 50-100 keV divided by fluence from 25-50 keV), we found that the bursts with plateaus tended to have smaller values of T90. A value of T90 longer than 2s indicates that the burst has some extended emission, which we are not seeing in any of the bursts with plateaus.
What's next?
One thing we would like to implement is statistical testing when we are sorting the bursts. With a simple χ2 cutoff, almost every burst is sorted into DPL. For many of these bursts, however, this is overfitting. Statistical testing would be a more reliable way to determine whether a SPL or DPL is a better fit. Additionally, more work needs to be done to investigate the bursts that were not well fit by either a SPL or DPL. Some of these bursts may need to be fit with a triple power law or possibly something even more complicated, and some have x-ray flares that need to be removed. We would also like to investigate the properties of the host galaxies. Based on a cursory look, the plateaus with host information available seem to be in higher mass galaxies; however, many sGRBs do not have host galaxy information available right now, so this will need to be investigated more in the future.
About Sarah
Sarah is a physics major and math minor at the State University of New York at Geneseo. They are entering their senior year. Outside of physics, Sarah is very interested in music, and they play violin and piano at Geneseo.
You can contact them at: sarahpopp314 [at] gmail [dot] com.
References
Berger, E. 2014, Annu. Rev. Astron. Astrophys., 52, 43-105
D'Avanzo, P. 2015, J. High Energy Phys., 7, 73-80
Evans, P. A. et al. 2007, Astron. Astrophys., 469, 379-385
Evans, P. A. et al. 2009, Mon. Notices Royal Astron. Soc., 397, 1177-1201

This material is based upon work supported by the National Science Foundation under Grant No. AST-1757792, a Research Experiences for Undergraduates (REU) grant awarded to CIERA at Northwestern University. Any opinions, findings, and conclusions or recommendations expressed in this material are those of the author(s) and do not necessarily reflect the views of the National Science Foundation.
This research was supported in part through the computational resources and staff contributions provided for the Quest high performance computing facility at Northwestern University which is jointly supported by the Office of the Provost, the Office for Research, and Northwestern University Information Technology.