Click here to visit my current website

Research

Abstract:

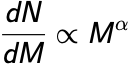
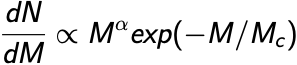
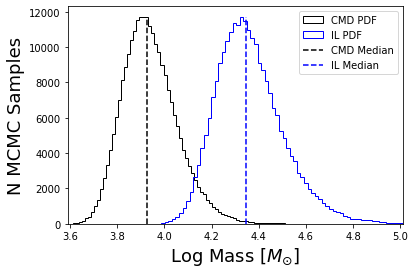
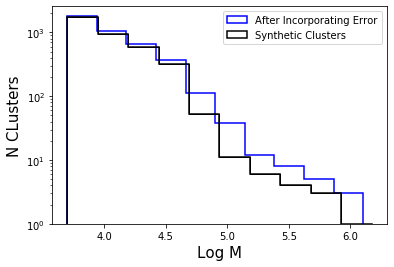
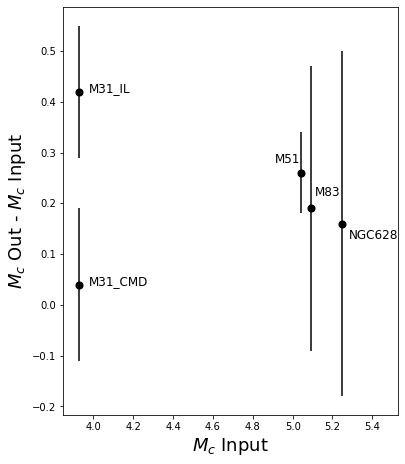
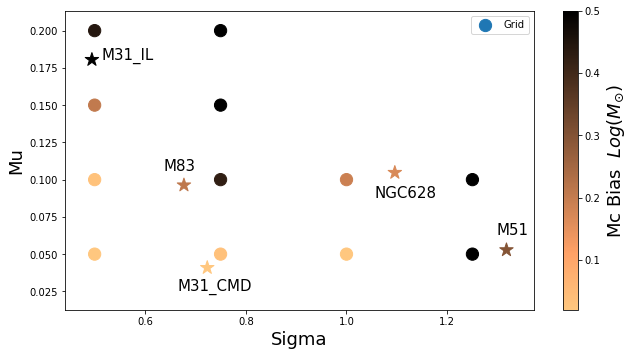
We measure the cluster mass function for 770 young star clusters in M31 whose ages and masses were derived through integrated light spectral energy distribution (SED) fitting. Although fits to integrated light observations lead to larger uncertainties than from other methods, a majority of extragalactic star cluster samples rely on integrated light fitting. We compare the integrated light SED mass function fitting results to the mass function results of these exact same clusters whose ages and masses were derived through color magnitude diagram (CMD) fitting previously published. Our mass function fitting, carried out using a probabilistic Markov chain Monte Carlo (MCMC) technique, confirms the existence of a high-mass truncation that is well described using a Schechter function. We find a power-law index of α = -1.91 ∓ 0.08 and a truncation mass of (logMc/M) = 4.35+0.13-0.10. This truncation mass is 0.4 dex higher than the previously published CMD value, suggesting that errors on the mass estimates of individual clusters can bias the upper mass truncation parameter of the cluster mass function to significantly higher values. We then run several experiments using M51, M83 and NGC628 incorporating individual cluster mass errors into a simulation mass function fit. We find that the high errors of the integrated light method of deriving ages and masses systematically biases the truncation mass towards higher masses.

Introduction:

The current paradigm in astronomy is that most stars form in star clusters (Larsen 2009; Bastian et al. 2012). By looking at observable properties of stellar clusters, studies have shown a correlation between the Star Formation Rate (SFR) surface density, ΣSFR, and the fraction of stars that form in clusters (Johnson et al. 2017; 2016; Adamo et al. 2015). More intense star formation therefore leads to a higher fraction of a galaxy's stars being formed in star clusters. Because of this link, star clusters encode the characteristics of previous star formation after formation happens (Johnson et al. 2017).

One measurable trait of a star cluster is the cluster mass function. A number of previous studies have defined the mass function to be consistent with a power law distribution,

where α is approximately -2. (Fall and Chandar 2012; Zhang and Fall 1999).

However, there has been an ongoing debate whether this power law holds at the upper end of the mass regime (>104 M). Because these clusters are rare relative to lower mass clusters, the shape of the mass function is harder to constrain at the highest masses. However, there is increasing evidence for an exponential high mass truncation (Gieles 2009; Adamo et al. 2015: Larsen 2009; Bastian et al. 2012; Johnson et al. 2017). These findings model the truncation mass distribution using a Schechter (1976) function,

where Mc is the characteristic truncation mass. The truncation mass is important because it gives us information about how massive clusters can get.

Definitions:

What constitutes a star cluster is highly debated in the literature with two standard definitions. What is generally debated is the first 10 Myr of a cluster's life where there is the existence of molecular gas, embedding the cluster, makes observation difficult. Some define a cluster as "any concentrated aggregate of stars with a density much higher than that of the surrounding stellar field, whether or not it also contains gas, and whether or not it is gravitationally bound" (Fall and Chandar 2012; Lada and Lada 2003).

Others define a cluster only in the existence of a gas free environment because young embedded groupings of stars (< 10 Myr), are still forming through hierarchical merging of sub-clumps, making it unclear whether the resulting structure will be a long-lived, gravitationally bound cluster (Allison et al. 2010; Gieles et al. 2012; Johnson et al. 2015). We choose to accept the latter definition because our data is derived through optical imaging, which is highly obscured in embedded clusters.

My Work:

My goal is to fit the cluster mass functin for M33 using the Local Group Cluster Search cluster catalog.

Previous measurements of the cluster mass function have focused on galaxies with moderate star formation activity (e.g., M51 and M83; Gieles 2009, Adamo et al. 2015), high-intensity starburst galaxy mergers (e.g., the Antennae; Zhang and Fall 1999; Whitmore et al. 2010), with only one study focused in the low-intensity galactic ΣSFR spectrum (e.g., M31; Johnson et al. 2017). M33's cluster population falls within the low-intensity galactic ΣSFR spectrum providing another data point that will yield "valuable leverage for evaluating possible systematic variations of the high-mass truncation of the cluster mass function" (Johnson et al. 2017).

Before fitting the CMF for M33, I wrote a code that needed to be tested, and so we fit the CMF for M31.

This plot from Johnson et al. (2017), represents where other galaxies with published Mc values fall as a function of ΣSFR, which is representative of star formation intensity.

Data:

The Primary motivation for this work was to fit the CMF for M33, however at the moment we do not have ages and masses for M33. The work for M33 will be utilizing the M33 Cluster Catalog presented in Johnson et al. 2020 (In Preparation). In order to test my code, and perform experiments with mass function fitting, we utilize the published mass function results from M31. The fit for M31 uses the Andromeda Project catalog published in Johnson et al. (2015) that utilizes PHAT data.

The Andromeda Project (AP) is a website directory built and hosted by the Zooniverse citizen science platform, where volunteers log into the website and perform cluster classifications. You can check out other zooniverse citizen science projects at zooniverse.org

For the AP, volunteers logged into the website and viewed images from the Hubble Space Telescope, from there they click on the image where they believe a cluster is located. The AP image database ensures that a user will not view the same image twice.

For M33 we will use the Local Group Cluster search which is an extension of the AP.

Here is an example of a Hubble Space Telescope image that a user would view and try to identify clusters.

From here, we analyze where the users clicked and make our catalog based on where the majority of users believe a cluster is located.

We find that generally our users do a really good job of identifying clusters. People always ask if it would be simpler for a machine to do the identification, and the answer is that for many reasons we prefer using people. The first is that citizen science projects get people involved and excited about science. The second is that a machine is really good at doing exactly what you tell it to do, and not much else. For example, if something seems weird in one of the images, our users will let us know and we can then analyze further, which has lead to new discoveries!

These are all of the user clicks from the previous image.
Methods:

We follow the statistical methodology of Johnson et al. (2017), performing analysis by deriving the cluster mass constraints from probabilistic modeling. Using the masses of all the clusters, we then ran a series of Markov chain Monte Carlo (MCMC) simulations to sample the posterior probability distributions of the Schechter, and power-law mass function parameters.

The technique of using MCMC simulations to sample the posterior probability distribution, deriving the cluster mass constraints from probabilistic modeling is similar to that of Weisz et al. 2013) for initial stellar mass fitting. In particular, we use the emcee Python package Foreman-Mackey et al. (2013) which takes advantage of the affine invariant ensemble sampler of Goodman and Weare (2010) to determine the functional form of the mass function through maximizing the likelihood of each star belonging to a mass function with given parameters.

For our MCMC calculation, we use 500 walkers, each performing 600 steps, of which we discard the first 100 burn-in steps. For the power-law function we report the median value of the marginalized posterior probability distribution function (PDF) for the single parameter α, as well as the 1σ confidence interval representing the 16th and 84th percentile range of the marginalized PDF. For the Schechter functional form we present the median value of the PDF for the two parameters, α, Mc, as well as the 1σ confidence interval for each parameter.

We use Bayes' theorem to derive the posterior probability distribution function for the Schechter parameters given as

Here, p(θ) is the prior probability of the Schechter parameters, and Mi is a set of N clusters where pcluster(θ| Mi, τ) is then the likelihood function for that set of clusters. The prior that we adopt is a uniform tophat prior distribution that covers the range of published values with plenty of cushion: -3 < α < -1, and 3 < Mc < 8.

The likelihood function for a set of clusters is defined as the product of the individual cluster mass probabilities given by,

where the normalization required to make likelihood function integrate to 1 becomes,

The pobs function represents a logistical funtion that is representative of the observational completeness. Observational completeness is a function of age τ.

Findings:

Errors on the mass estimates of individual clusters can bias the Mc parameter to significantly higher values.

As a test of concept for the code that I wrote, I run the MCMC simulation on the Johnson et al. (2017) cluster catalog and recover the published result. This set of clusters had ages and masses derived through fitting a color magnitude diagram (CMD). These exact same clusters also have masses derived through integrated light (IL) spectral energy distribution (SED) fitting, a less accurate way of making this measurement.

Here are the error distributions for the 2 methods. These histograms confirm that the CMD method is more accurate than IL as IL has higher mass errors.

For the less accurate method of deriving ages and masses for the same clusters, the Mc parameter of the mass function was driven higher by 0.4 dex as shown by the Mc PDF for the two methods on the left

This raises the question if other published CMF fits that use the IL method of deriving ages and masses are biased.

Here are the Mc PDF's for the 2 methods. We can see that the IL method PDF is significantly offset from the more accurate CMD method.
Other Galaxies With Published Mass Function Fits, that also have high error distributions potentially biasing the fit.

To test the effect that mass uncertainty has on the function fit in other galaxies, we create a synthetic distribution with the same number of clusters and an α, and Mc that was published. We then assign each cluster a mass error of an associated real cluster and draw a random number from a gaussian with the σ of the mass error. Finally, we run an MCMC simulation and compare the Mc to the value of the original distribution, and run 25 trials per galaxy.

An example of a synthetic distribution modeling M51, as well as the same distribution after implementing the published error.
The Mc PDF's before and after the implemented error.
Results from running 25 trials of this analysis per galaxy along with the error bars. Galaxies with a low number of clusters such as NGC628 and M83 have higher error bars, but there is a consistent trend that Mc is driven higher for IL method masses.
Developing a Model to predict Mc Bias given a set of Parameters:

In order to generalize each galaxy's error distribution, we fit a lognormal parameterized by mu and sigma. As represented by,

We then run a grid of models with a variety of input parameters and compare to the observed galaxies. For 5 trials and a simple grid, we find decent agreement.

Our initial grid of models, with 5 trial MCMC simulations per point.
Future Work:

We are working on further developing our model to be more precise with more trials. The next step is to develop a method of taking mass error into account when fitting the CMF. The motivation for this work is to fit the CMF for M33 based on the Local Group Cluster Search cluster catalog which is what I have been working on for the last 2 years.