Finding Gravitational Wave Signals from Core Collapse Supernovae

CIERA REU project by Sinead Humphrey


Core Collapse Supernovae X-Pipeline Problems with Nearest Neighbor Clustering Connectivity References Acknowledgements

Core Collapse Supernovae

Core collapse supernovae (CCSNe) occur at the end of the life of massive stars between 8M☉ and 100M☉. Due to the force of gravity, the core of the star will collapse until it reaches nuclear densities. The equation of state (EOS) stiffens above nuclear density and the inner core rebounds generating a shock wave that propagates outward. The shock wave eventually stalls because of lost energy from nuclear dissociation and neutrino emission. The stalled shock becomes an accretion shock. If the shock remains stalled, matter will accrete onto the proto-neutron star (PNS) until it forms a black hole. However the shock can be revived within 0.5 - 3s by some explosion mechanism. There are two likely explosion mechanisms that might be present in CCSNe: The neutrino mechanism and the magnetorotational mechanism. The neutrino mechanism is considered to be more likely. It is thought that some of the energy from the neutrinos released during core collapse is reabsorbed behind the initial shock and this reabsorbed energy powers the explosion. The magnetorotational mechanism is more likely to be present in rapidly rotating CCSNe. A rapidly rotating pre-collapse core can form a millisecond period PNS and if a very strong magnetic field is also present, the combination of the two could power the explosion.

A symmetrical core collapse will not emit gravitational waves (GWs); however asymmetries in CCSNe are expected to emit GWs that could be within the sensitivity range of our current interferometers. GW signals from the magnetorotational mechanism are typically shorter and have a larger amplitude than those from the neutrino mechanism. They are typically characterized by a spike at core bounce. GW signals from the neutrino mechanism are characterized by having features produced by turbulence. They are typically between 0.3 - 2s long and have an amplitude of 10^-22 if the source was 10kpc away.

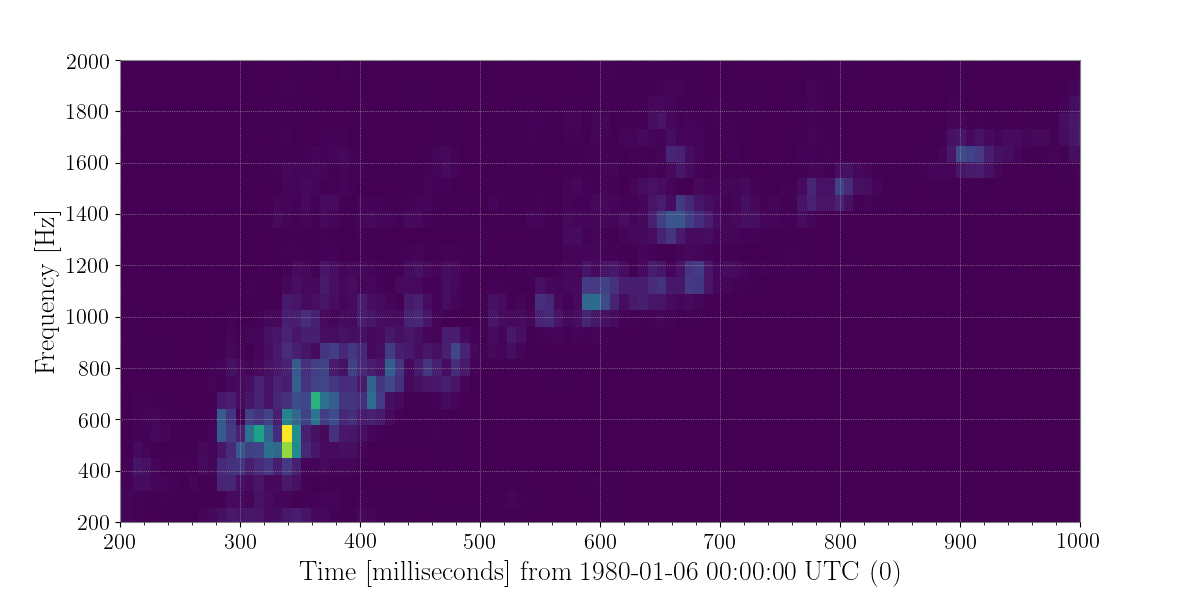
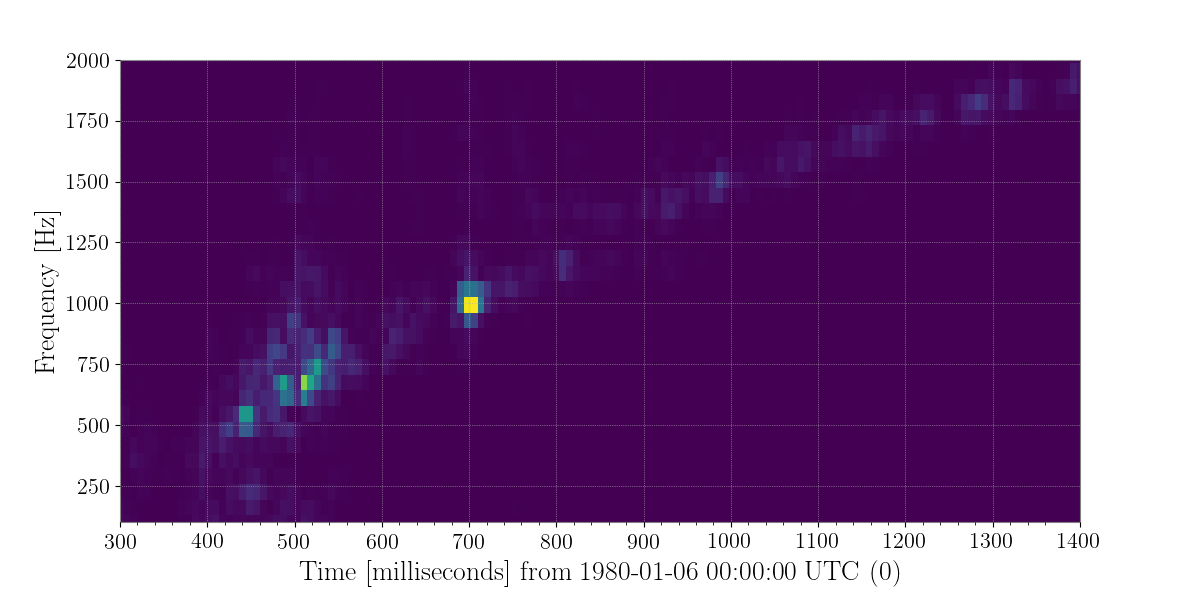
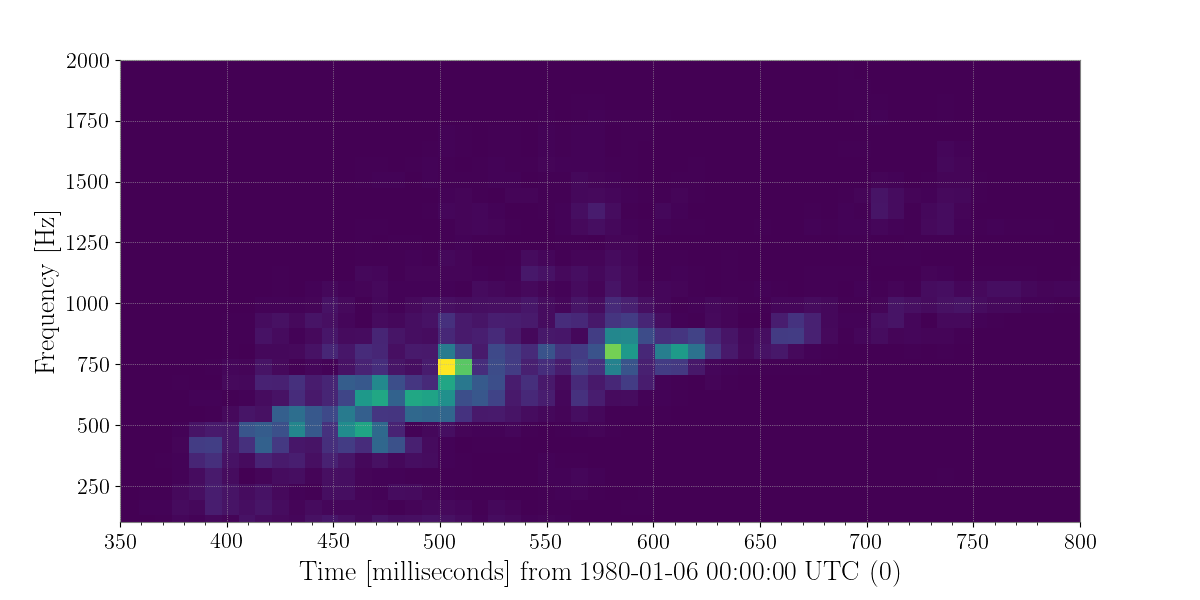
In the post bounce phase, multiple different processes could be responsible to the emission of GWs in the neutrino mechanism model. These include convection inside the PNS and the postshock region, the standing accretion shock instability (SASI), and nonaxisymmetric instabilities. Morozova et al. (2018) found that for most CCSNe, the GW signal in the first 50 ms after bounce depends on the progenitor mass and the EoS. This early signal is weaker than other features in the GW signal except in the case of their rotating model. After this signal, there is 50 ms quiescent phase followed by the dominant part of signal beginning around 150 ms after core bounce, with frequencies ranging between 300 to 2000 Hz.

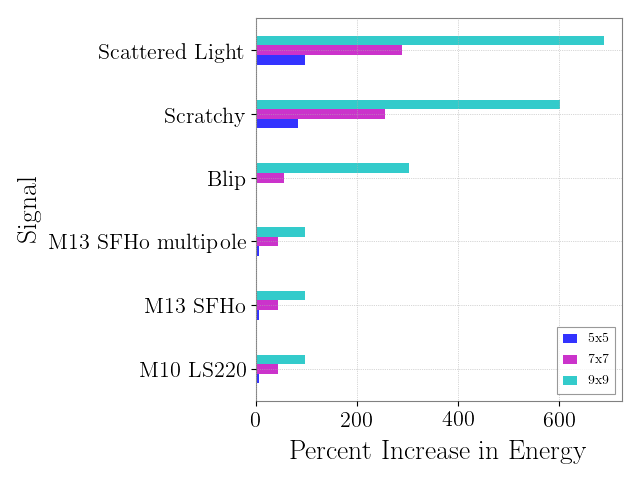
The GW signals from these events would give us more information about the astrophysical parameters of the sources including the likely explosion mechanism. Before such information can be discerned, the signal must be found in the gravitational wave data. Although numerical relativity simulations exist for these signals, the stochasticity of the explosion and the computational cost makes finding these signals impossible to do with match filter search. In addition, the signal strength is expected to be small and a galactic CCSNe is expected to be our best bet at seeing a signal. Thus, any improvement in recovering more energy from a generic supernova signal will prove critical to discovering one occurring in our galaxy.

Back to top
A simulation of a CCSN with a neutrino driven explosion (left) and a magnetorotational driven explosion (right). Credit: Christian Ott/Caltech (simulation), Steve Drasco/Cal Poly San Luis Obsipo (visualization) (neutrino); Philipp Moesta, TAPIR, California Institute of Technology (magnetorotational)

X-Pipeline

X-Pipeline is an algorithm designed to search for gravitational wave bursts (GWBs). X-Pipeline uses data from multiple interferometers, so the first step of the analysis is to time shift the data so that the signals from each detector are in phase with each other. To do this, the sky location of the source must be known either through neutrino or electromagnetic signals from the same event. The data are then whitened and transformed into pixels on a time frequency map. The "loudness" of each pixel is determined by the detection statistic. The detection statistic is often based on the energy in the data, and is used to rank events as more or less consistent with models of gravitational waves.

Coherent consistency tests are also used to remove non-Gaussian noise transients, or "glitches", that might be seen as loud signals only present in one detector. To do this, X-Pipeline projects the data onto the null space; this projection should only contain noise. This can only be done if for n assumed polarizations, there are n + 1 data streams. Thus for the commonly assumed plus and cross polarizations, three data streams would be needed. However if a circular polarization is assumed, only two data streams are needed to create the null space. The null energy, the squared magnitude of the projection onto the null space, contains both cross-correlation and auto-correlation terms. If the auto-correlation terms dominate, the signal is not correlated between the detectors; thus it is likely to be a glitch and is rejected.

The pixels on the final time-frequency map are then grouped using the "nearest neighbor" method in order to get the most energy from a signal while having as little noise as possible. The loudest pixels are grouped with their "neighbors", other loud pixels adjacent to them, in order to form an event.

This procedure is used on simulated GW signals inserted into real background data from the detectors as well as on real background data alone. By comparing the results from the GW signals with the background data, the coherent consistency tests are tuned. Independent background data are then used to estimate the distribution of background data that are not rejected by the coherent consistency tests. The sensitivity of the coherent consistency tests is evaluated using different simulated GW signals at varying amplitudes in order to find the amplitude limit below which a GW signal could not reliably be detected.

Back to top

Problems with Nearest Neighbor Clustering

Figures 1, 2 and 3 show time-frequency maps created using X-Pipeline of CCSNe models from Morozova et al. (2018) As can be seen in all three figures, a majority of the signal looks stochastic and the few loud pixels are not all connected and would thus be unlikely to be grouped by the "nearest neighbor" method.

Back to top

Figure 1. M10_LS220

Figure 2. M13_SFHo

Figure 3. M13_SFHo_multipole

Connectivity

We first wanted to increase the connectivity used in the clustering method. The default connectivity is 8, which corresponds to a 3x3 grid with the center pixel omitted. If the connectivity is increased, then the grid increases and there can be a greater distance between "neighboring" pixels, which may allow for a greater recovery of the energy from a CCSNe signal. In order to test the effects of different connectivities, we injected three GW signals from simulated CCSNe at a distance of 10kpc into random noise and compared how much energy was recovered using connectivities of 8, 24, 48 and 80, corresponding to 3x3, 5x5, 7x7, and 9x9 grids. This same procedure was done to 30 different noise transients or "glitches" found in real LIGO data. Three types of glitches were used: "Scattered Light", "Scratchy" and "Blip".

Figure 4. shows a graph of the percent increase in recovered energy of each signal at varying connectivities. 10 examples of each type of glitch were analyzed individually and their resulting percent increases in energy were averaged. The three CCSN signals, "M13 SFHo multipole", "M13 SFHo" and "M10 LS220", all show similar increases in the energy recovered which shows that increasing the connectivity does lead to increased energy recovery from these signals and therefore similar signals are more likely to be detected when using a larget grid size.

However the three types of glitches, "Scattered Light", "Scratchy" and "Blip" also increase in energy recovery, especially at larger grid sizes. We are exploring if the increase in recovered energy from the noise transience, corresponds to them being more likely to fail coherent consistency tests. Because the percent increase in energy is similar between the three CCSNe signals but different between the glitches and the CCSNe, the percent increase in energy between connectivities could be used as a way to identify supernovae signals. Work is underway to utilize principal components to reconstruct a rough template for CCSNe signals and employ that template for the clustering.

Back to top

Figure 4. Connectivity results

References and Further Reading

Morozova, V., Radice, D., Burrows, A., & Vartanyan, D. (2018). The Gravitational Wave Signal from Core-collapse Supernovae. The Astrophysical Journal, 861(1), 10. doi:10.3847/1538-4357/aac5f1

Was, M., Sutton, P. J., Jones, G., & Leonor, I. (2012). Performance of an externally triggered gravitational-wave burst search. Physical Review D, 86(2). doi:10.1103/physrevd.86.022003

Sutton, P. J., Jones, G., Chatterji, S., Kalmus, P., Leonor, I., Poprocki, S., . . . Was, M. (2010). X-Pipeline: An analysis package for autonomous gravitational-wave burst searches. New Journal of Physics, 12(5), 053034. doi:10.1088/1367-2630/12/5/053034

Kent, C. (2016). Searching for Gravitational Waves Associated with Supernovae. Cardiff University, School of Physics and Astronomy

Zevin, M., Coughlin, S., Bahaadini, S., Besler, E., Rohani, N., Allen, S., . . . Kalogera, V. (2017). Gravity Spy: Integrating advanced LIGO detector characterization, machine learning, and citizen science. Classical and Quantum Gravity, 34(6), 064003. doi:10.1088/1361-6382/aa5cea

Back to top

Acknowledgements

This material is based upon work supported by the National Science Foundation under Grant No. AST-1757792. Any opinions, findings, and conclusions or recommendations expressed in this material are those of the author(s) and do not necessarily reflect the views of the National Science Foundation.

Back to top

Author contact: sineadhumphrey[at]gmail.com