Introduction
Messier 35( M35 or NGC 2168) is a young open cluster in the Milky Way. Open clusters are easier systems to study, as all the stars in the system are roughly the same age and are fewer in amount than globular clusters. Since open clusters have younger stars, a smaller radius, and a less dense population of stars, it is easier to observe and study them. M35 has an estimated age of 150-215 Myr, and is centered at α = 6h09m07.5s and δ = +24◦20′28, with the mass of the cluster estimated to be 1600-3200 M⊙[2]. M35 is an ideal cluster for observing and studying tidal tails due to its age and clear separation from field stars. Field stars are stars that are no longer part of any star cluster, and this is what the final stage of a star cluster looks like, more specifically for open clusters. Tails form in the cluster as the cluster orbits the galaxy, as the gravitational pull from the center of the galaxy causes some stars in the cluster to drift closer to the center. Thus, the cluster forms two distinct ‘tidal tails’ where one tail points to the galactic center and the other tail points away from it. Tidal tails of star clusters are the transitional phases of the cluster joining the galactic field and the stars of the cluster becoming field stars. Open clusters are more likely to have tidal tails since their orbits are on the spiral arms of galaxies, and the larger orbit leads to the radial velocity of some stars decreasing. (Jerabkova et al. 2021) Using N-body simulations and observable data it is possible to study the stellar evolution of star clusters. We utilize GAIA data and N-body simulations to make observations about the open cluster M35. Specifically, we identified which stars from the simulation are potential cluster members based on a color-magnitude diagram and their radial velocities. In the future, we hope to explore more about the properties of tidal tails which can be found here “Future Observation/Simulation” .
Methodology
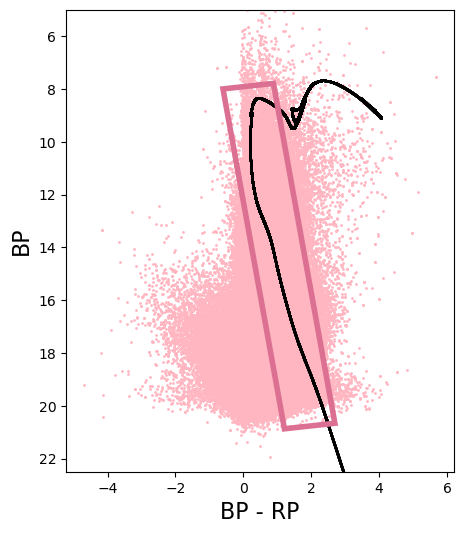
To obtain the initial conditions of M35, we use the AMUSE[3] software to de-evolve the cluster to when it was first born. Using the initial coordinates, we run an N-body simulation using galpy[1] in order to model what the cluster looks like in the present day. Galpy's coordinate system is left-handed, so we made the x-position, y velocity and z velocity negative to counteract this. Since we needed to convert from galctocentric cartesian to ra and dec which is in degrees, it was integral that we had the correct sign on the values. We plotted the simulation in RA and Dec and multiple simulations with the same initial conditions were run and then combined to obtain a robust set of simulated stars. The cluster was split into 3 parts, the upper and lower tail and the cluster center. Then plotted the proper motions and radial velocities of each section. The stars from the simulation were matched to stars from GAIA data. We manually picked points in the simulation and downloaded the GAIA data at that point until the enite simulation was covered. We utilized M35 photometry data given by Anna Childs to plot an isocrhone over a color-magnitude diagram(CMD). From there we identified which stars were the members of the cluster by drawing a rectangle that fit over the isochrone. Then we plotted the proper motions and radial velocities to compare to the simulation. In future research, we hope to utilize the convergent point method to identify cluster members as well as visualize the data more efficiently.

Results
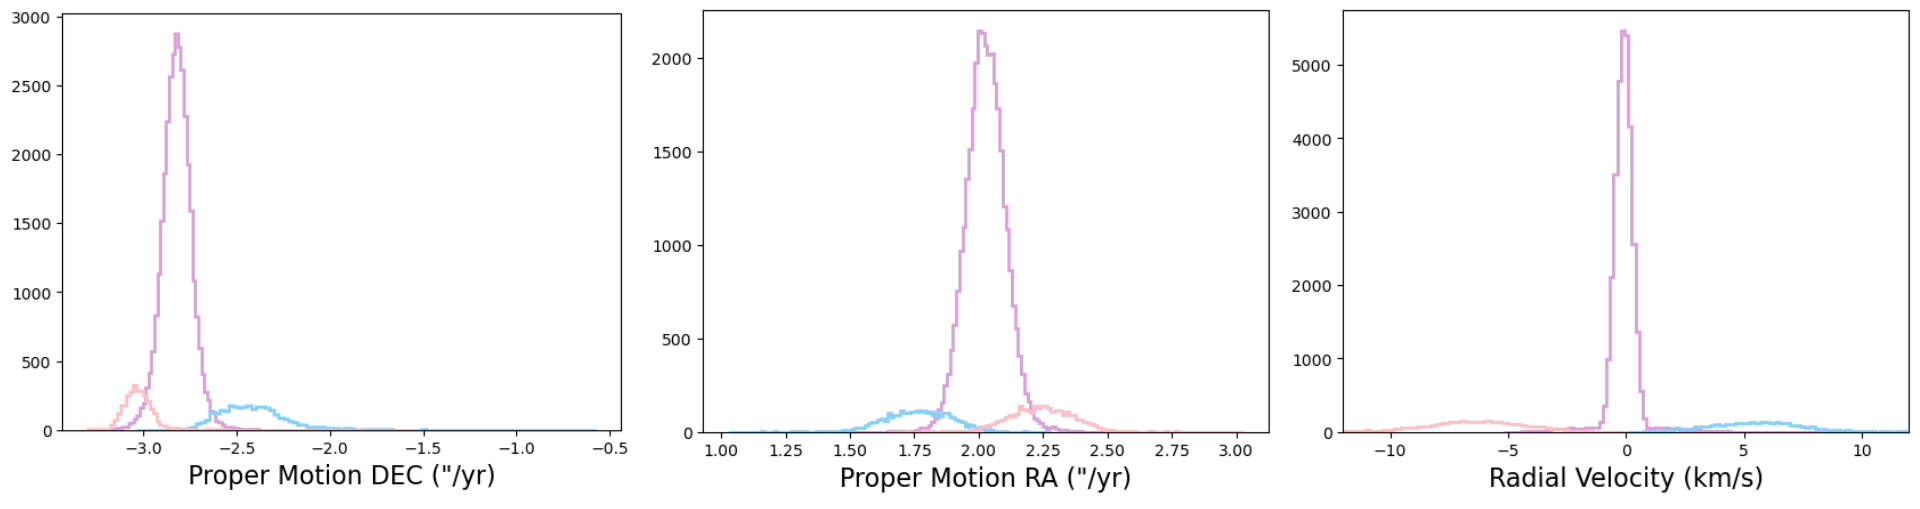
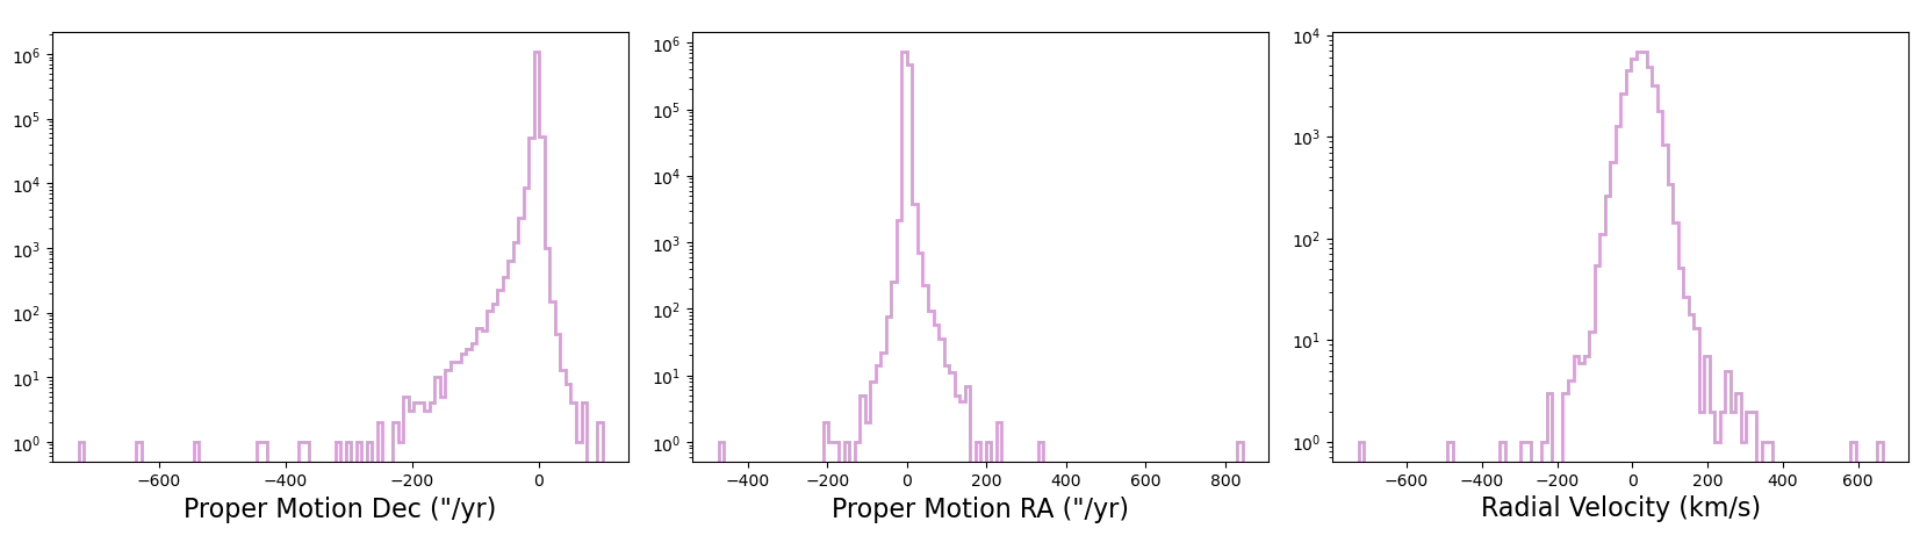
The radial velocity and proper motion histograms for the simulations show the expected peak in the center of the cluster(labeled in purple), while the tails (pink and blue) have smaller peaks. This is because there is a higher concentration of stars in the center of the cluster than the tails of the cluster. The GAIA data shows a similar trend in the radial velocity, however there is a discrepency in the proper motions graphs. The GAIA data has 3 million stars while the simulation has only 39,000, but the GAIA data also has a lot of field stars that we weren't able to filter. Our next step is to refine the cluster members using other methods.
Future Observations/Results
The future goal for this project is to use the n-body simulations to explore various topics related to the nature of tidal tails. The next immediate goal is to use the convergent point method[4] to identify members. This method determines the point at which the stars are moving from in the celestial sphere. We can use the simulations to understand how dark matter accumulates in galaxies. Hypothetical data indicates that tidal tails should form symmetrically, stretching out from Lagrange point one and Lagrange point two, but this is not the case[5]. This can be explained due to areas in the galaxy where more dark matter tends to accumulate, thus causing asymmetries in the tidal tails of the cluster. A more precise simulation would be required to observe this, as the current simulation is simply and the slight asymmetry in the tails is due to some errors in the simulation. Another facet to study is the presence of exotic stars and binaries in the main cluster versus the tails. We can compare the populations of these stars and see if there is a significant difference in the cluster. Another aspect could be because massive stars tend to accumulate in the middle of the cluster, while lower-mass stars reside in the tails of the cluster. This could indicate that exoctic stars are more likely to be present in the middle of the cluster rather than the tails of the cluster, based on the way mass segregation occurs. Studying the tails can give us a better insight into stellar evolution and how galaxies form.
Refrences
- Bovy, J. (2015). Galpy: A Python Library for Galactic Dynamics. The Astrophysical Journal Supplement Series, 216(2), 29. https://doi.org/10.1088/0067-0049/216/2/29
- Geller, A. M., Mathieu, R. D., Braden, E. K., Meibom, S., Platais, I., & Dolan, C. J. (2010). Wiyn Open Cluster Study. XXXVIII. stellar radial velocities in the young open cluster M35 (NGC 2168). The Astronomical Journal, 139(4), 1383–1393. https://doi.org/10.1088/0004-6256/139/4/1383
- Portegies Zwart, S., & McMillan, S. (2018). Astrophysical Recipes. https://doi.org/10.1088/978-0-7503-1320-9
- A refurbished convergent point method for finding moving groups in the ... (n.d.). https://arxiv.org/pdf/astro-ph/9903239.pdf
- Reinoso, B., Fellhauer, M., & Véjar, R. (2017). Formation and evolution of substructures in tidal tails: Spherical Dark matter haloes. Monthly Notices of the Royal Astronomical Society, 476(2), 1869–1876. https://doi.org/10.1093/mnras/stx2900
About Me
I'm a math and physics major at Loyola University Chicago. I play jazz vibraphone in my free time, as well as making origami models. My academic interests are combinatorics, differential eqautions and astrophysics! I really enjoyed working with Aaron Geller this summer and I'm continuing my research during the school year.
Contact Info: amadasi@luc.edu, anurathi.suresh.madasi@gmail.com

This material is based upon work supported by the National Science Foundation under grant No. AST 2149425, a Research Experience s for Undergraduates (REU) grant awarded to CIERA at Northwestern University. Any opinions, findings, and conclusions or recommendations expressed in this material a re those of the author(s) and do not necessarily reflect the views of the National Science Foundation.