Do We Need LSST for Kilonova Discovery?
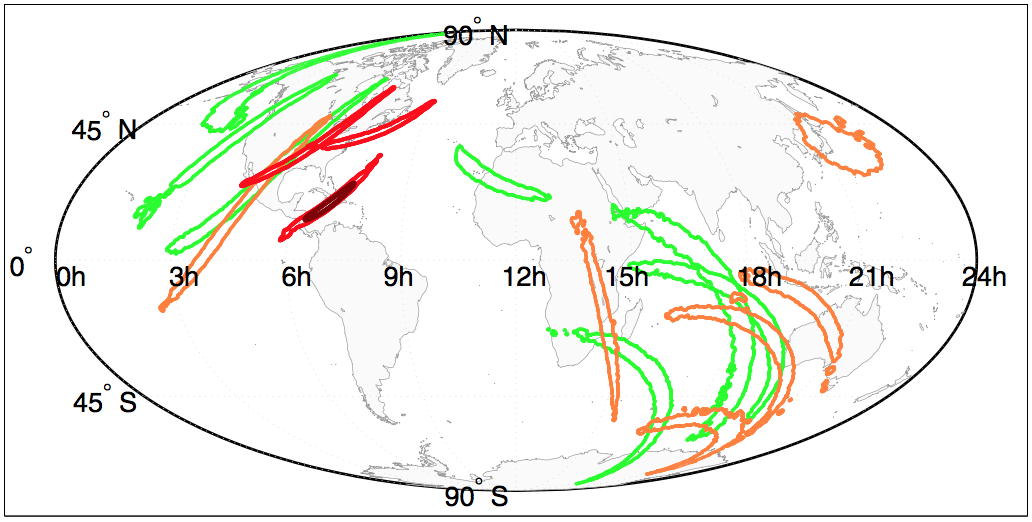
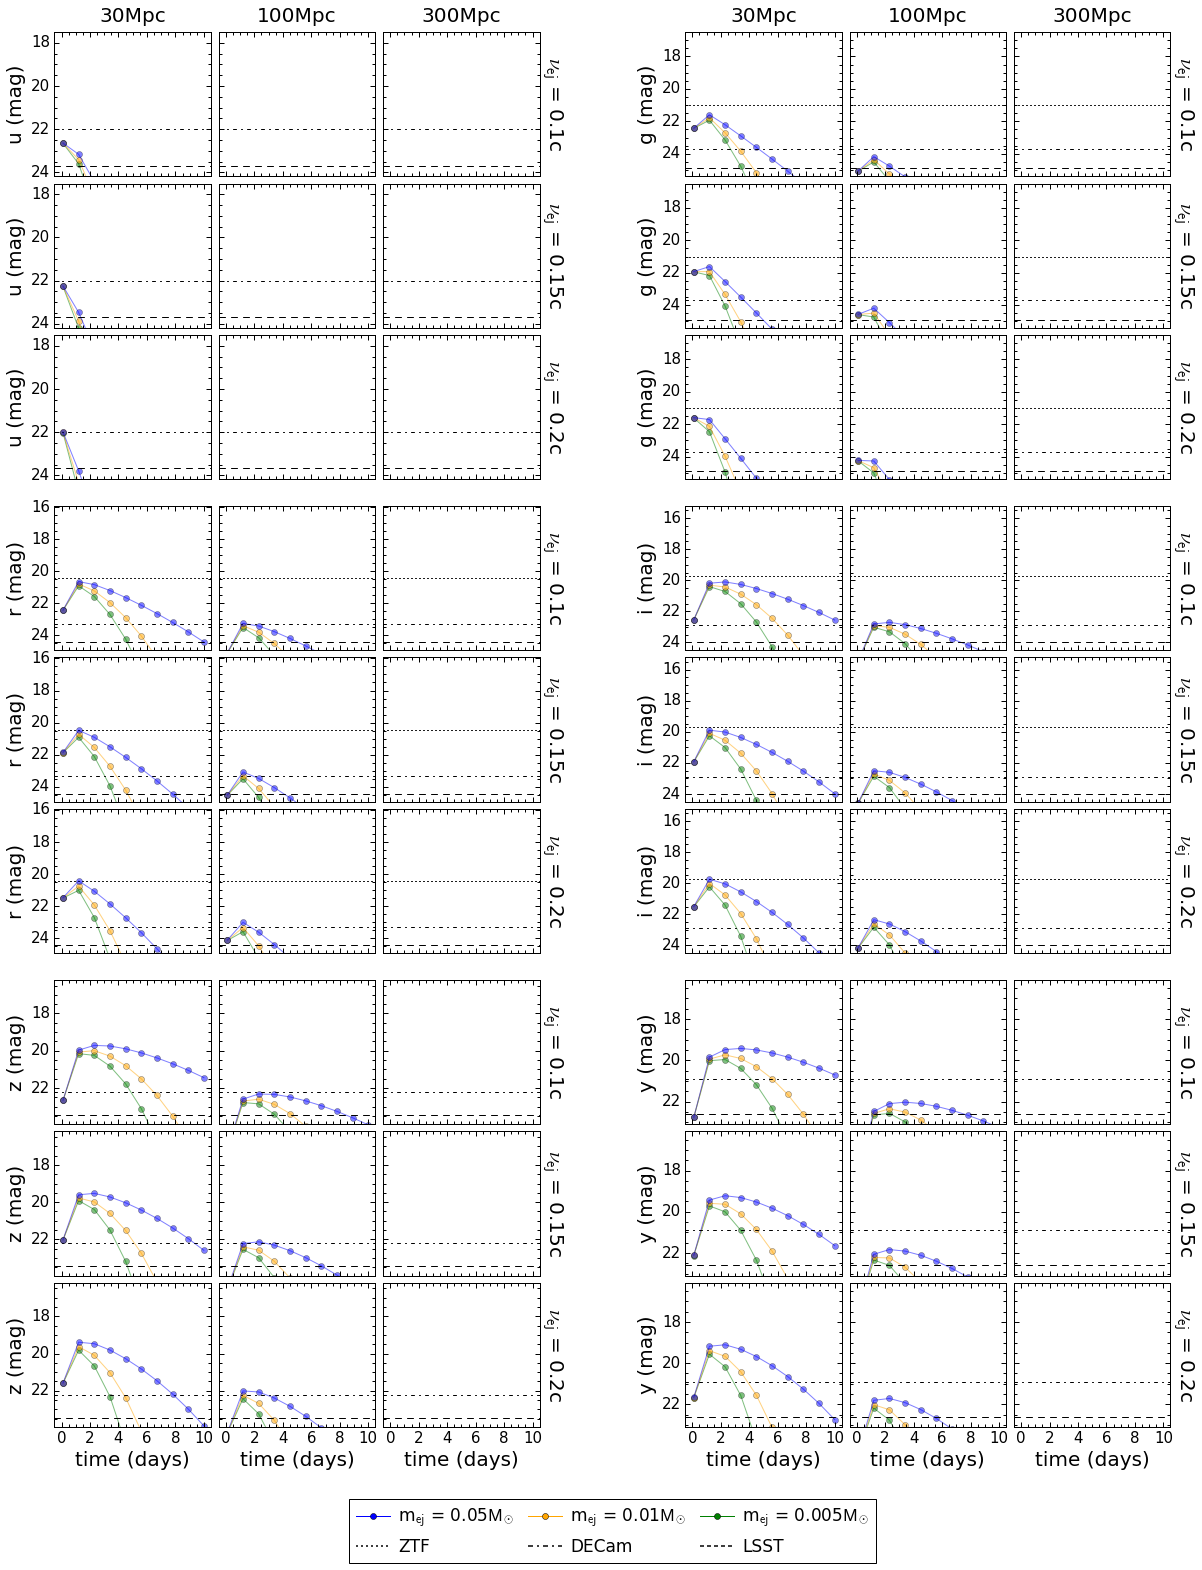
GW170817 was significantly brighter than theoretical expectations. If most kilonovae are similar to GW170817, then that raises a critical question: should LSST be used for LIGO follow-up? We simulate a large suite of kilonova models while tracking how long LSST could observe the event compared to two modern-day telescopes, the Zwicky Transient Facility (ZTF) and the Dark Energy Camera (DECam). We chose two types of kilonovae: one-component “red” kilonovae, which are theoretically expected to be more common, and two-component “blue” + “red” kilonovae, which are consistent with the characteristics of GW170817 (models adapted from Villar et al. 2017). The results of the simulations are below.
| One-Component Kilonovae | Two-Component Kilonovae |
|---|---|
 |
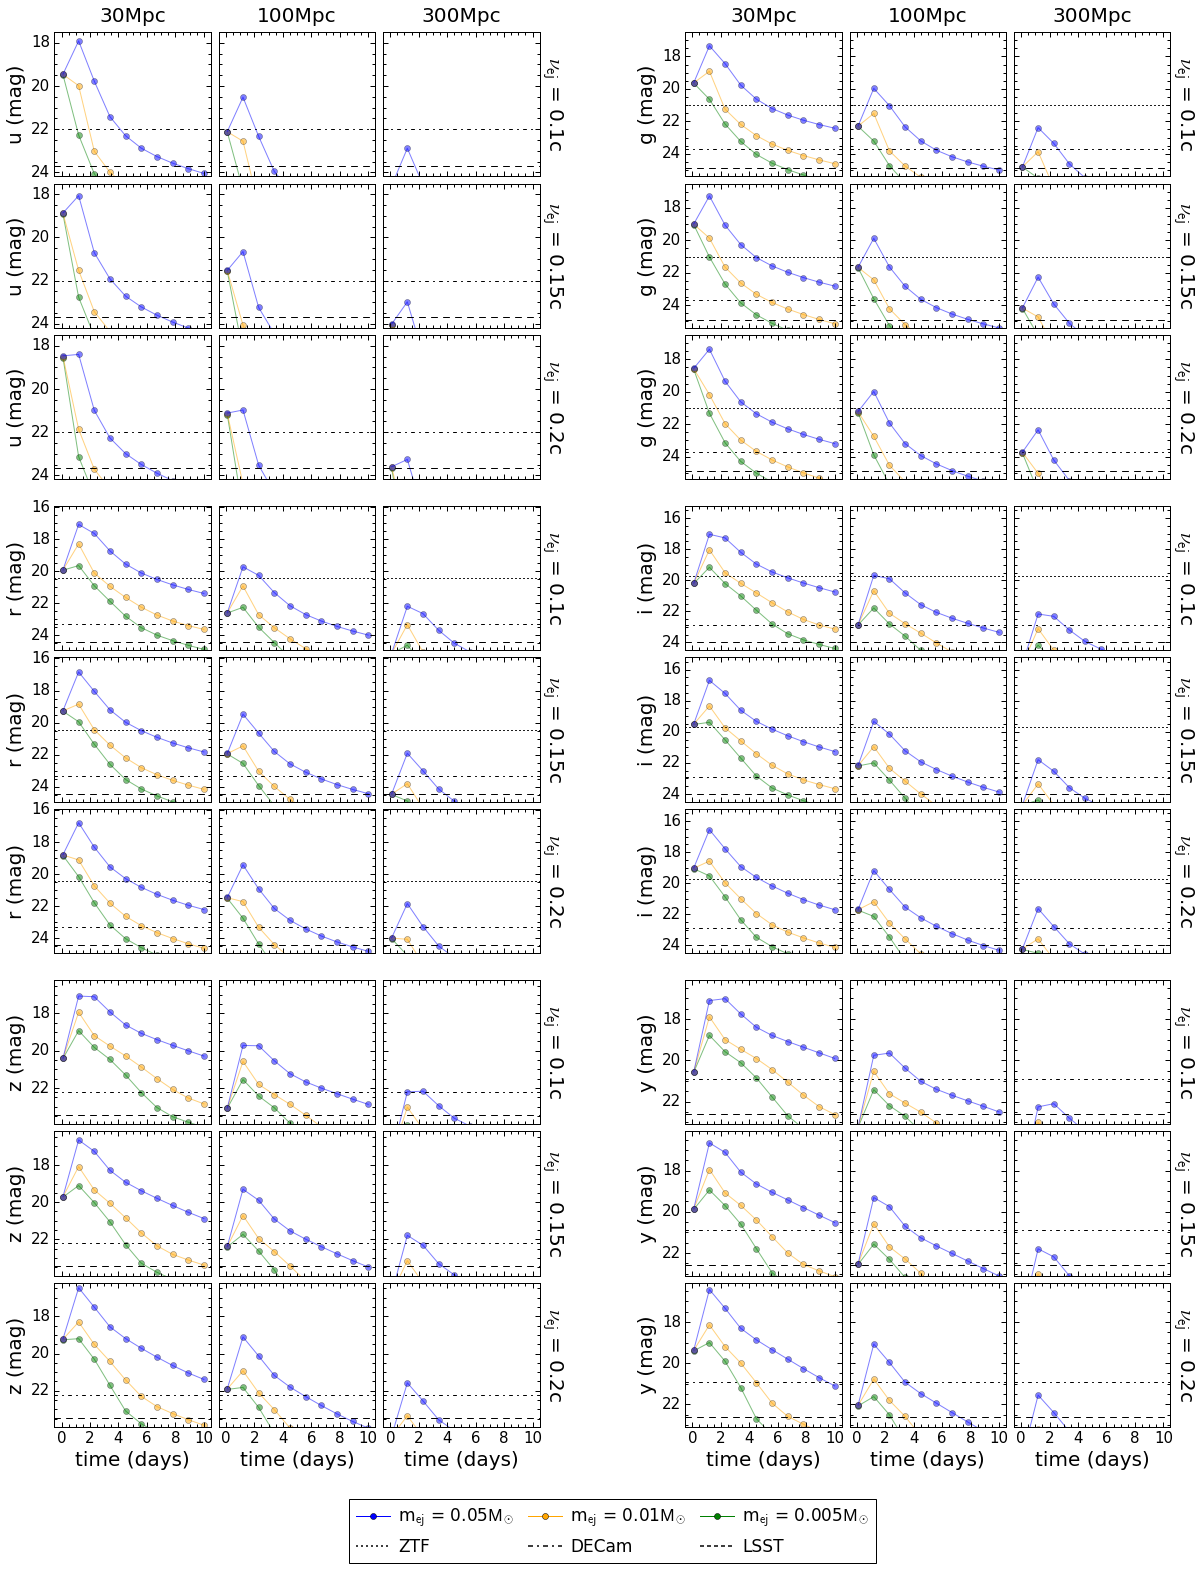 |
Under the optimistic assumption that most kilonovae match GW170817, we find that LSST ToOs will play a critical role in kilonova discovery. Ejecta mass is the primary factor controlling the kilonova luminosity. While the total ejecta mass for a typical merger remains an open question, gravitational wave astronomers predict that typical Advanced LIGO BNS detections in the LSST era (2022+) will be at a distance of 200–300 Mpc. Thus, for current facilities it will be difficult to detect kilonova emission. While ZTF or DECam could increase their exposure times, they cannot compete with the depth/areal coverage of LSST. Even with a 5 detector LIGO network, there will be several events with localization areas of several hundred degrees and LSST ToOs will play a critical role in discovering and understanding those events.
Discovery Metrics
Problems for LSST
While it may seem trivial to create a proper cadence for LSST to measure a portion of the sky, the problems increase when the telescope needs to discover a kilonova. Some of the issues are:
- Kilonova light curves diminish from view over the course of 7-10 days.
- There is a 12-hour delay for LSST to receive information from a source that LIGO detected.
- There are two different types of kilonova light curves depending on the type of merger.
- The light of a kilonova spans from the UV to the NIR.
- Kilonovae are scattered in areas filled with supernovae, gamma ray bursts, and other transient sources that may confuse LSST to think they are kilonovae.
- The weather may be too poor for proper observing.
Basic Discovery Metrics
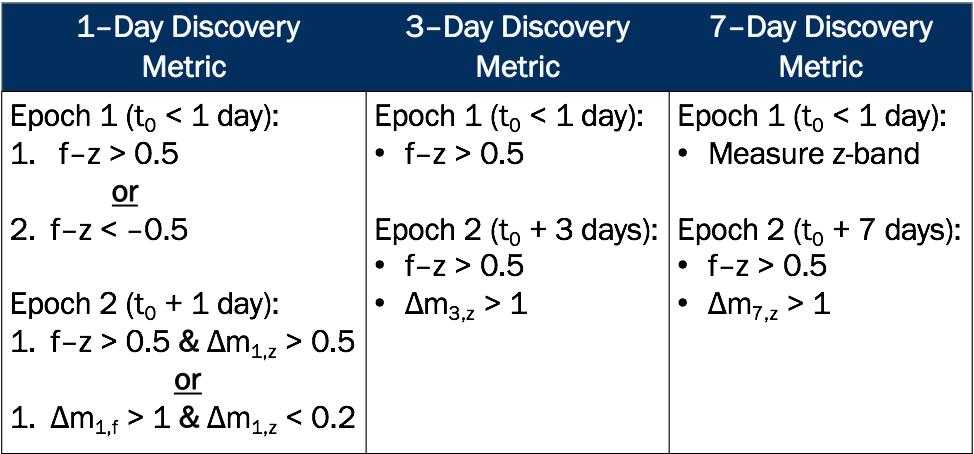
To optimize the success rate of the LSST, we decided to concentrate on the kilonova's defining features: it's relatively cold explosions, and it's short visibility time. Since kilonovae are typically colder than other stellar explosions, they tend to have a "red" color (f-z > 0.5 where f is a filter other than the z-band). However, other theories suggest there are "blue" kilonovae (f-z < -0.5) also may exist, so we included blue kilonova in the 1-day discovery metric. Apart from color, the short visibility time means a large change in magnitude (Δm) in one of LSST's filters.
Using theoretical light curves from Tanaka and Hotokezaka (2013), we designed and simulated three discovery metrics (see table below) for various NS-NS and NS-BH mergers. Each discovery metric simulation has the following criteria:
- Maximum of 4 observations by LSST.
- First observation happens at a random time in a 24-hour period.
- If LSST cannot observe due to bad weather (20% probability), then it will observe 24 hours later.
- The farther away the kilonova is, the harder it is for LSST to detect it.
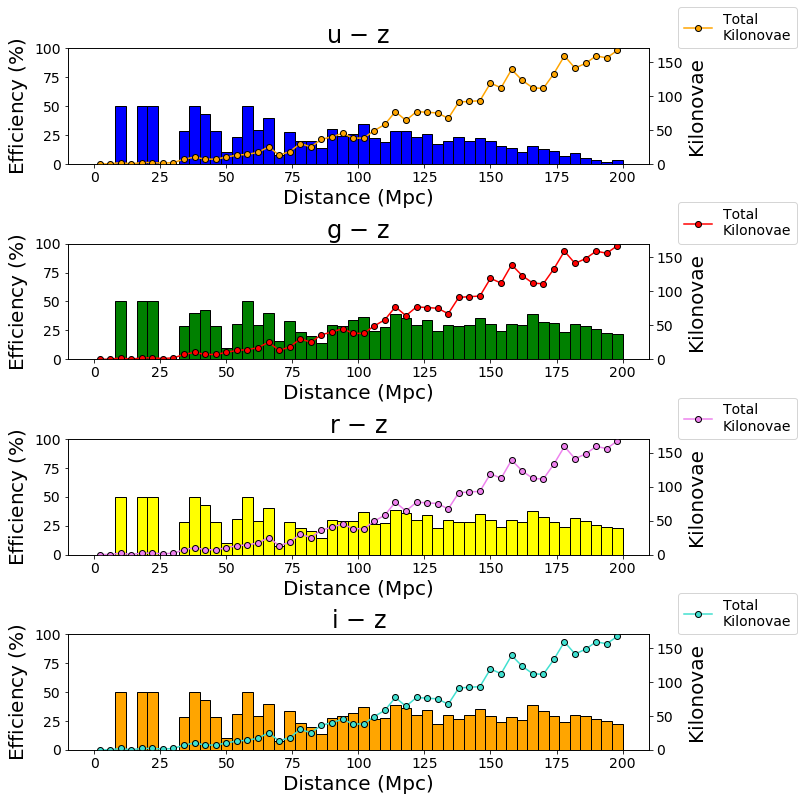
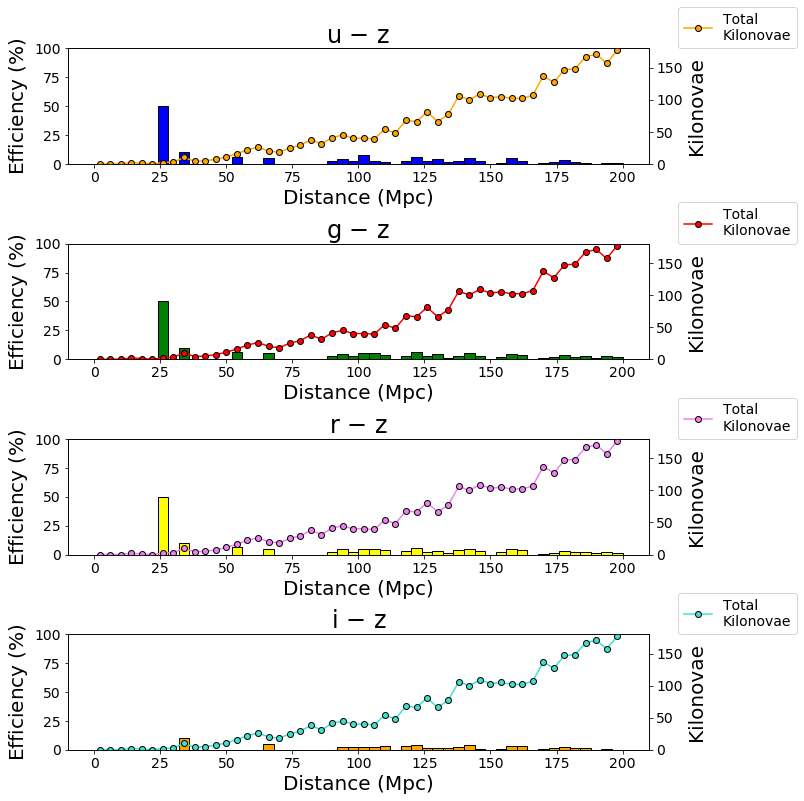
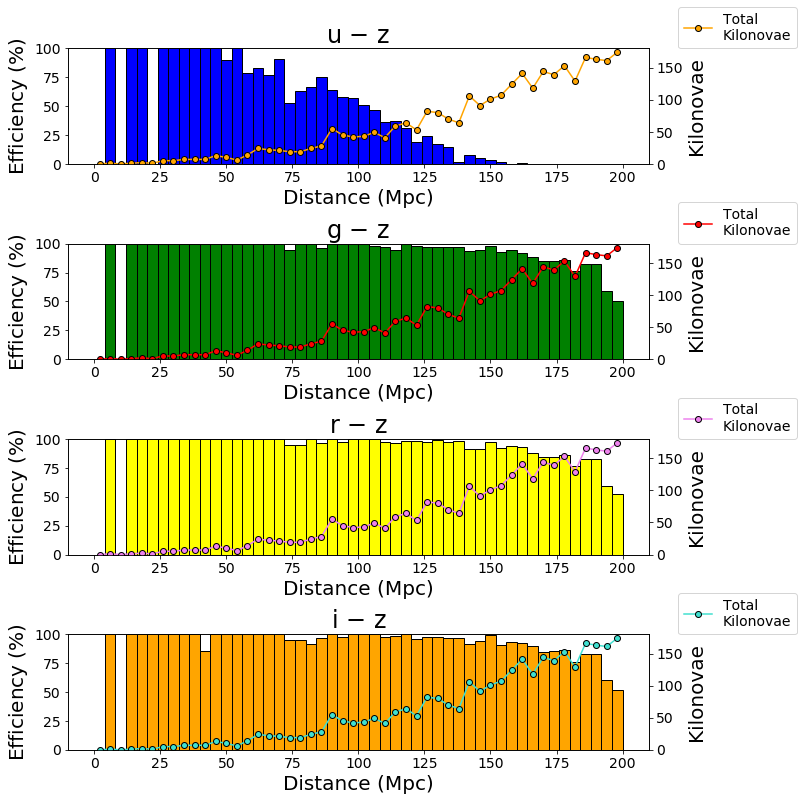
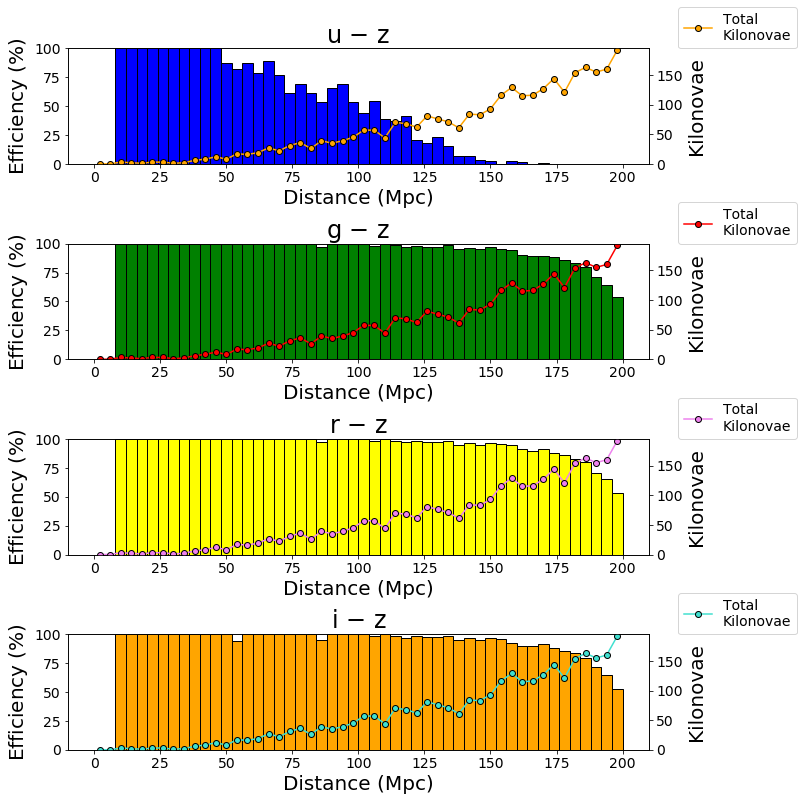
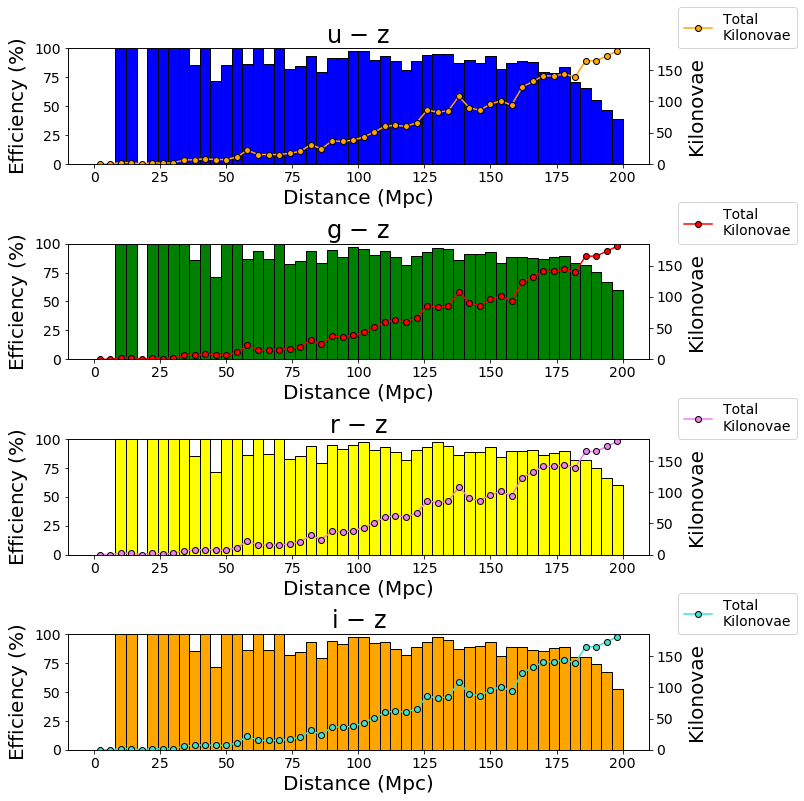
We then created efficiency plots for how well LSST was able to discover kilonovae at different distances with these metrics. The histogram shows the efficiency of LSST at a particular distance and the data points shows the total number of kilonovae that LSST could have discovered.
1-Day Discovery Metric
| NS-NS Efficiency Plot | NS-BH Efficiency Plot |
|---|---|
 |
 |
3-Day Discovery Metric
| NS-NS Efficiency Plot | NS-BH Efficiency Plot |
|---|---|
 |
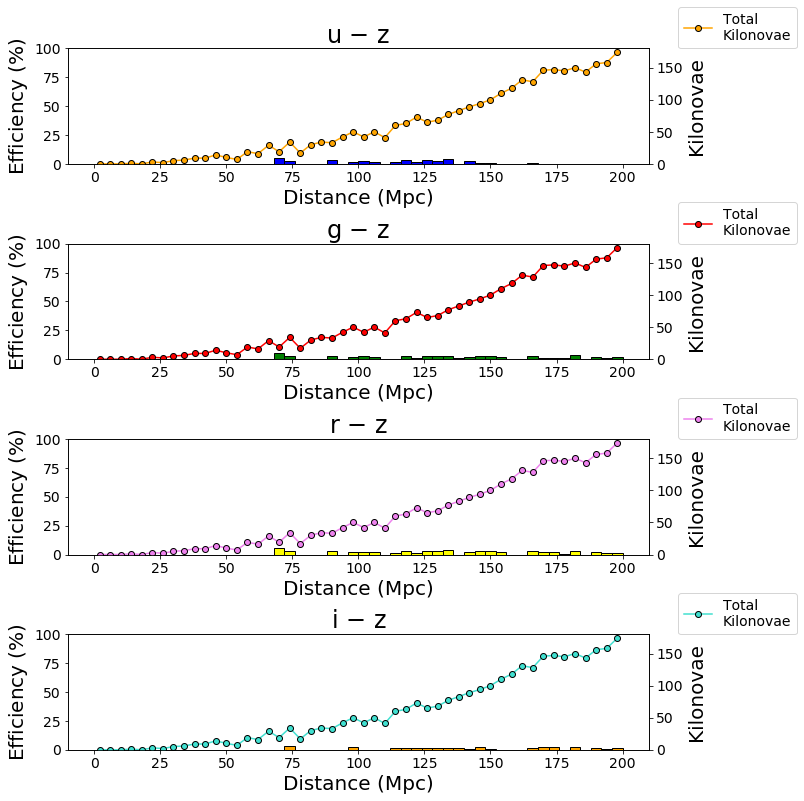 |
7-Day Discovery Metric
| NS-NS Efficiency Plot | NS-BH Efficiency Plot |
|---|---|
 |
 |