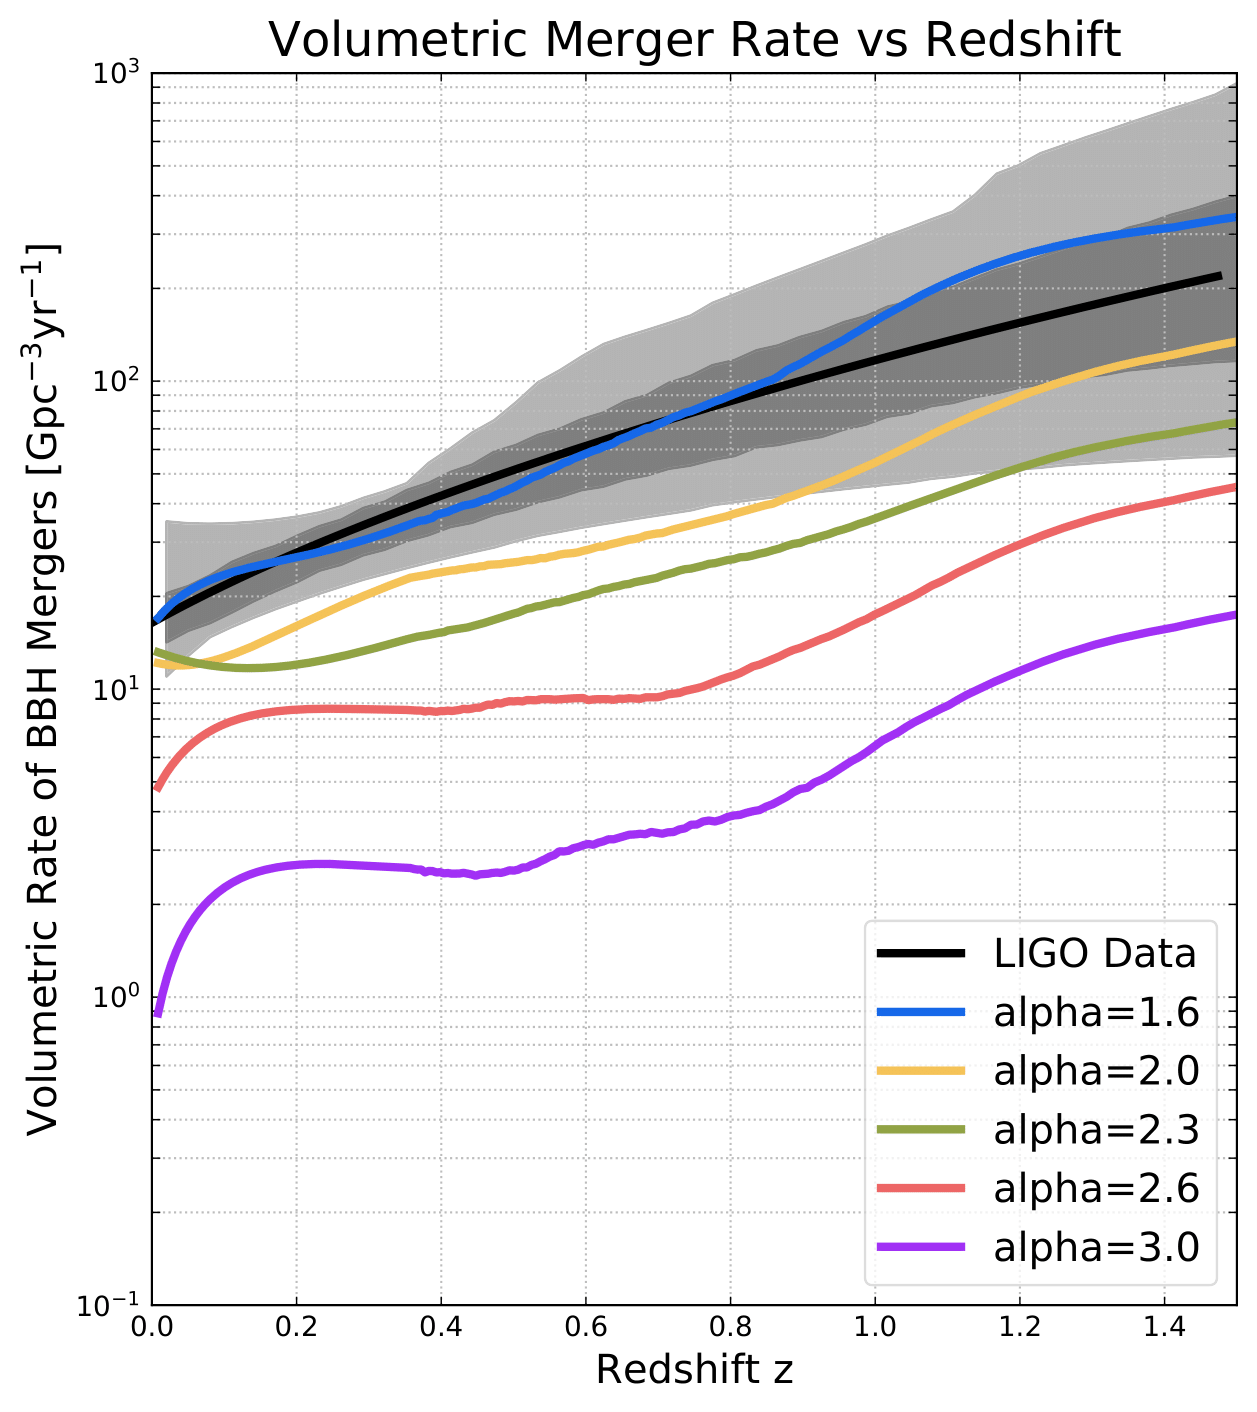
Figure 1: Volumetric rate of BBH mergers over redshift. Central 50% (dark gray) and 90% (light gray) credible bounds on the BBH merger rate. LIGO data from LIGO/Virgo/KAGRA et al. (2021).
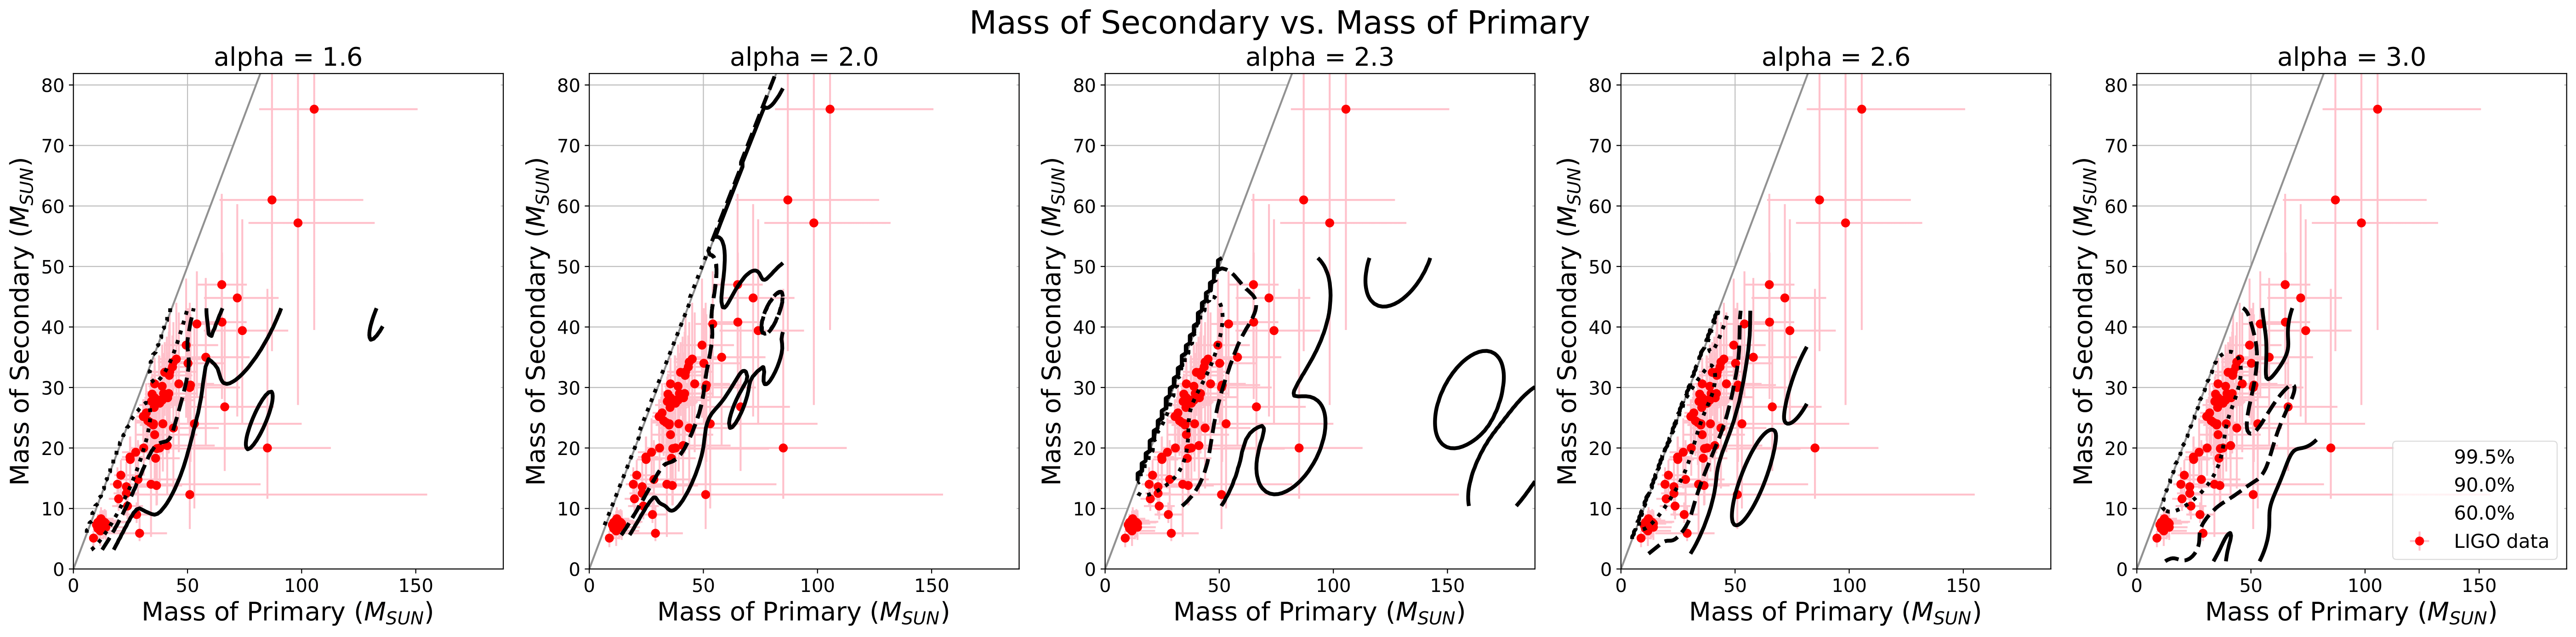
Figure 2: Component masses of BBH mergers extracted from cluster models (black contours) and from LIGO (red circles with error bars). Each plot shows simulation data for a different value of α3.
Figure 1 relates merger rates from simulations to observational data. It shows that simulation rates best match observational
rates for α3=1.6, α3=2.0, and α3=2.3.
Figure 2 has five different α3 values. In a BBH merger, the primary mass is the mass of the larger BH. In this
plot, the simulation data for α3=2.0 and α3=2.3 match most closely with the observational
data.
Overall, the simulation data for α3=1.6, α3=2.0, and α3=2.3 match most closely with
the observational data.
This process has produced constraints for α3, but there are still steps to be taken before a definitive result
can be given.
I will improve the accuracy of the constraints on α3 by incorporating simulations of stellar environments
outside of clusters
into this analysis (simulations need to include BBHs from the field). The current simulations only look at BBHs formed in stellar
clusters while LIGO data is not limited to cluster BBHs.
However, cluster simulations can still be used to put constraints on α3
if assumptions are made about the fraction of mergers that clusters contribute to the overall merger rate. For example, if I assume
that clusters contribute X% to the overall merger rate, I can calculate the overall merger rate compared to LIGO data. This
would allow me to put constraints on the number of top-heavy clusters in the Universe.
As a separate note, this data indicates that clusters with top-light IMFs are unlikely to be large contributors to the overall merger rate.
Another next step
for this project will be to produce an updated grid of simulation models and perform this analysis based on that grid. The
current models being used do not allow for three-body binary formation (Mansbach 1970). Furthermore,
the binary period
distributions and radii of giant stars need to be updated to remain consistent with recent data.
Preliminary results show that α3=1.6, α3=2.0, and α3=2.3 are the most accurate α3 values. This indicates that α3 is slightly less than or equal to its canonical value, which either means that the current understanding of the IMF is accurate (α3=2.3) or that there are a greater number of massive stars formed in the universe than current theory suggests (α3=1.6, 2.0). With more work on this project, I will put more accurate constraints on the value of α3 in the IMF.