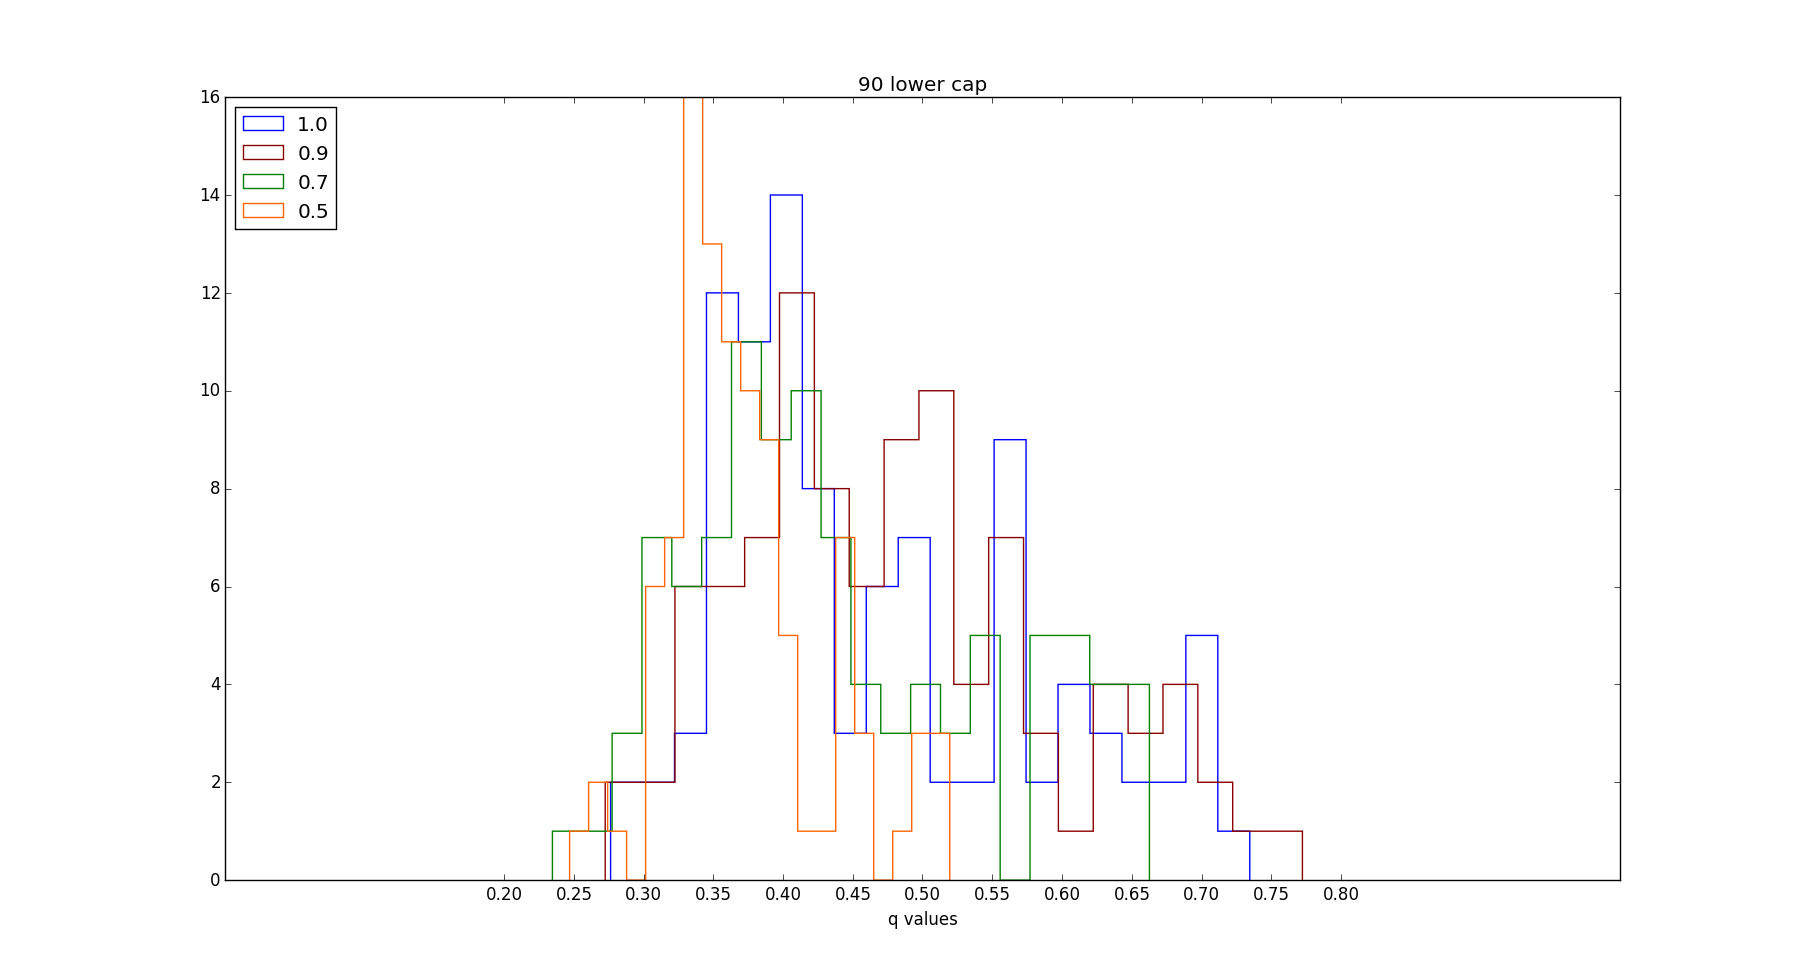
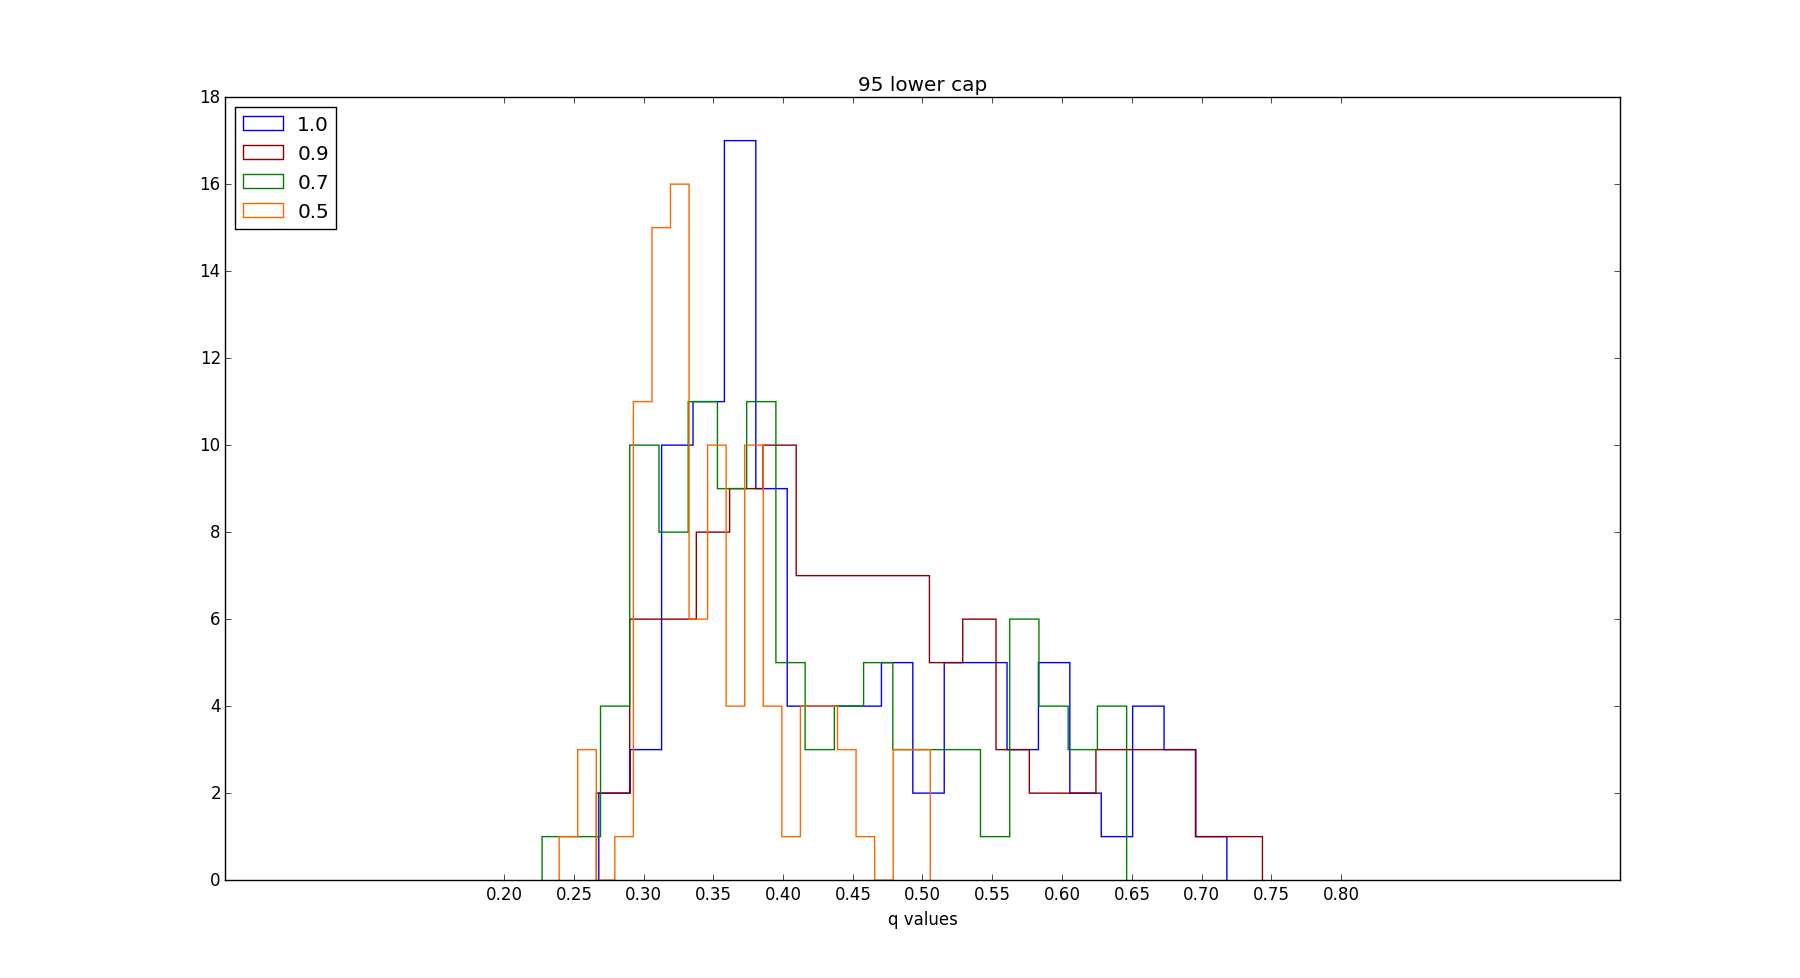
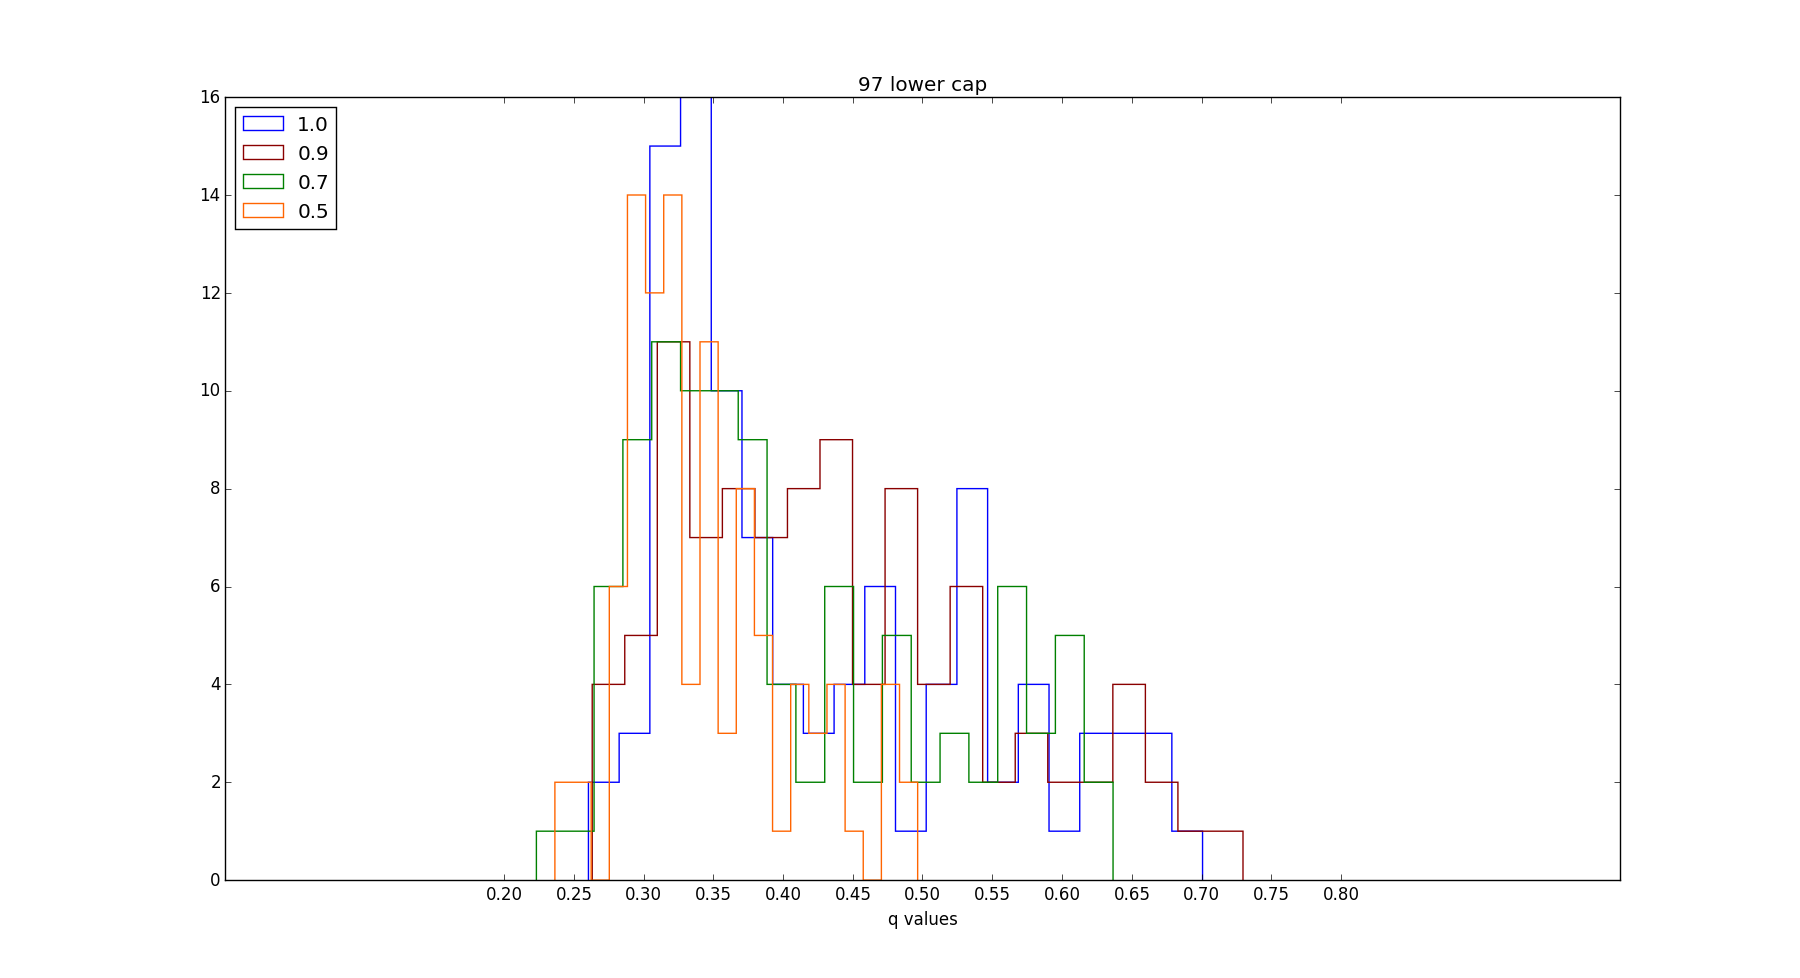
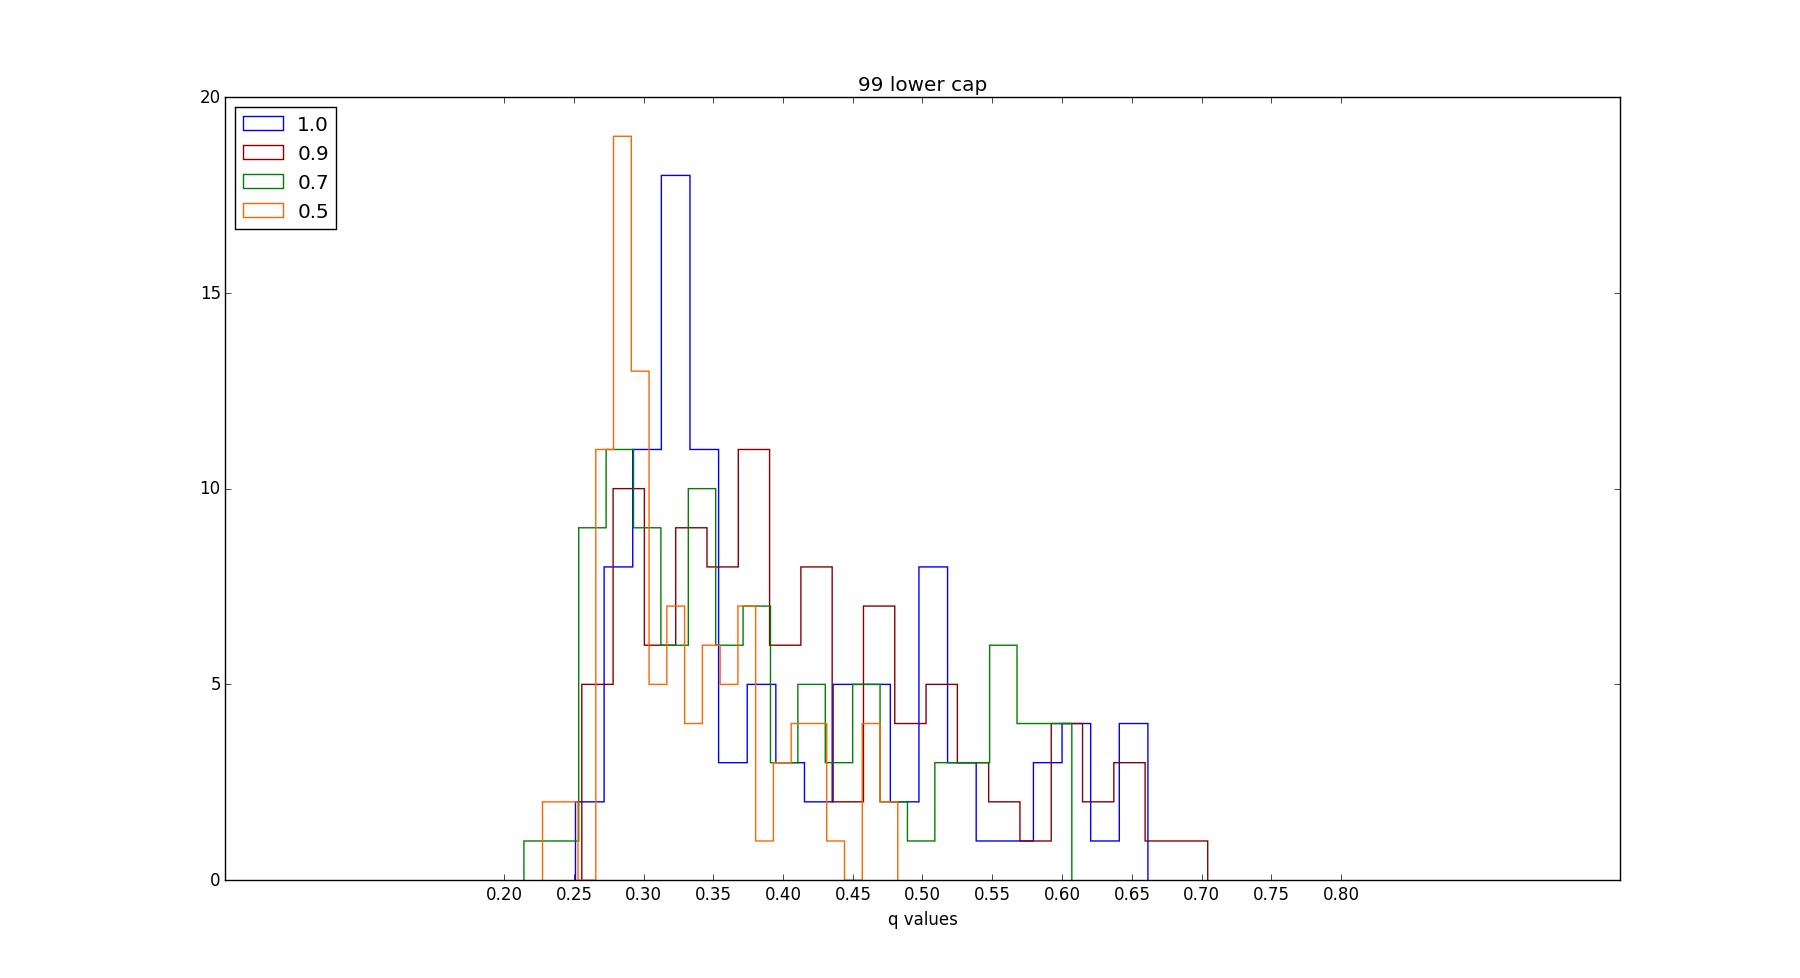
Histogram plots are shown to be: Figure 1: A (90), B (95), C (97), and D (99) display the lower caps of the injection runs. Values are constrained to this 0.25 validity region within all histogram plots. Due to these values not being able to pass this boundary, it is implied that this waveform can not pass mass ratios as high as 1:4.
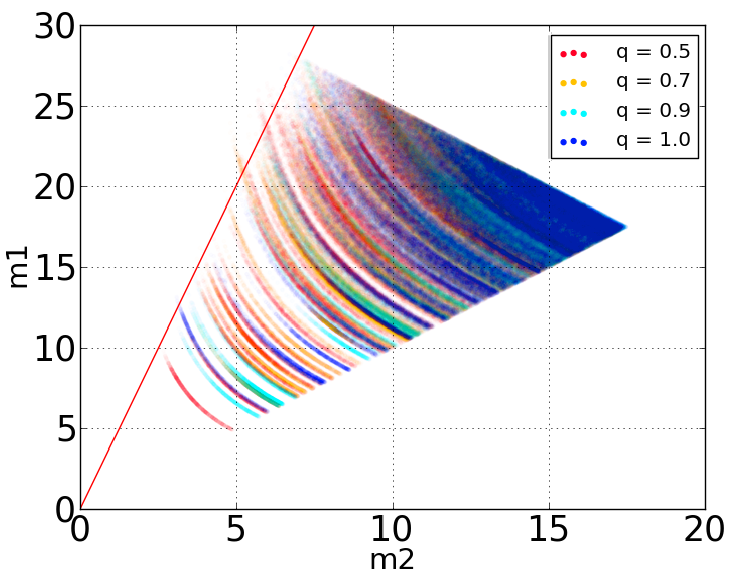
Further implication is provided in the triangle plot. This plot shows all values for the mass ratios. Solid Red line (Y=4x) indicates this boundary (1:4). Better illustrating the limitations of the mass ratio for this specific waveform.