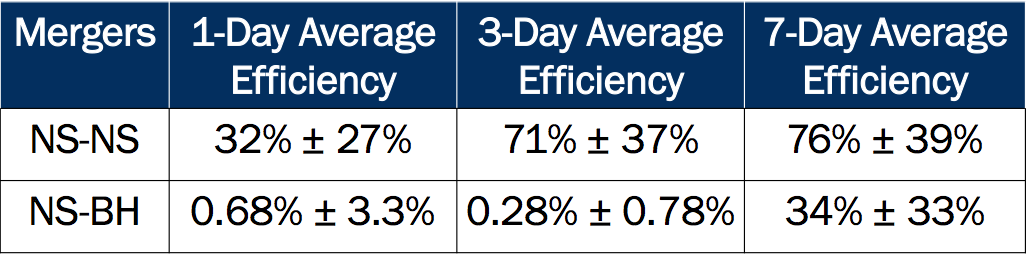
The table provides the average kilonova discovery efficiencies for the light curves of five NS-NS merger kilonovae and four NS-BH merger kilonovae. The data shows that while the mean efficiencies for the 7-day discovery metric are higher than 1-day and 3-day, the statistical error indicates that there isn't a significant difference between the three discovery metrics, so we will need to look more into the metrics to see which one is optimal. The error is only statistical since we are working with purely theoretical data, so we don't know how much error LSST will produce in these measurements. Moving forward, we will reduce this error by running the metrics on thousands of randomly generated kilonova to see which of the three discovery metrics are the most efficient. Also, we will be looking at more discovery metrics than these three to make sure LSST's discovery metric will be the most optimal. Lastly, we will look into the individual filters of LSST, including the y-band, to see which colors between filters are also the most optimal for discovering kilonovae. Despite the data that we have received thus far, there is much more work that must be done.