Non-parametric Methods to Map Stochastic Gravitational-Wave Spectrum with LISA
Supervisors: Dr. Sharan Banagiri and Dr. Vicky Kalogera @ Northwestern CIERA
Overview
Laser Interferometer Space Antenna (LISA) is a space-based telescope designed to study gravitational waves
in the millihertz frequency range1. In the this frequency band, the incoherent superposition of Double-White-Dwarfs (DWDs) results in a loud and detectable foreground, a type of the stochastic gravitational waves. Through the study of DWD spectrum,
we can gain more insights into the population properties of the galactic DWDs and set tighter constraints
on galactic scale height. In this study, we use a non-parametric method to map
the power spectrum of the galactic DWD foreground.
While the spectrum generally follows a power law, deviations from the behavior is possible, as a result of various astrophysical properties of galactic DWDs2.
An autoregressive process3 is a non-parametric method, wherein the value of a function at a point stochastically depends on the value at previous points. In particular, we use the first order autoregressive process which is continuous everywhere but not necessarily differentiable. In this project, we use AR process to fit the PSD of the foreground and hierarchically infer the paramters of the autoregressive process model and recover galactic DWD power spectrum using Bayesian inference pipeline for LISA, BLIP4. The autoregressive process is more flexible than other hyper-parametric methods like a power law model, so we can recover other high frequency structure that depends on the detectability of LISA, galactic structure, and intrinsic properties of DWDs such as chirp mass distributions2. This non-parametric model is validated through a series of simulations and analyses, including the recovery of a power law spectrum and a more realistic spectrum using a galactic structure model and simulations of DWDs.

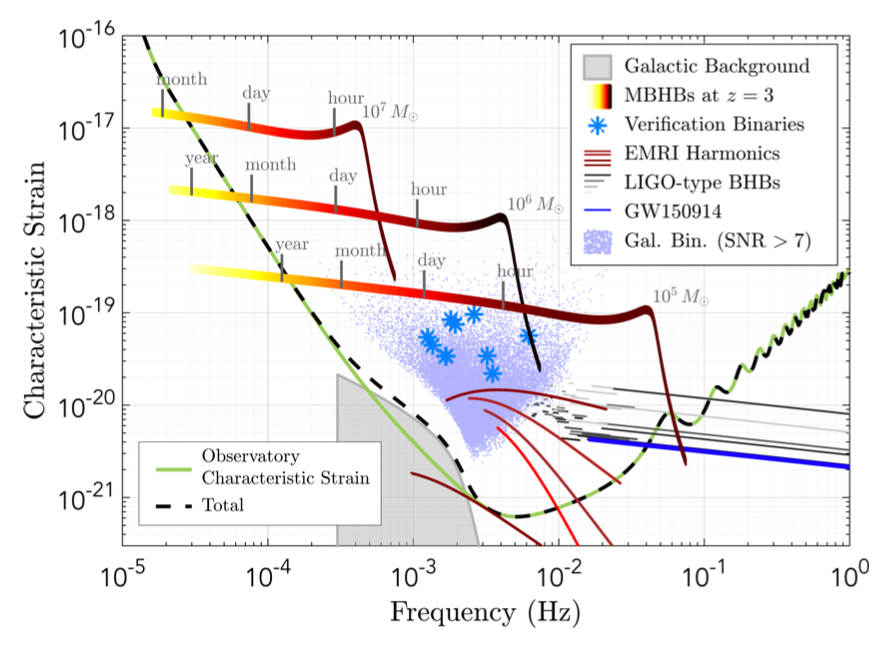
A plot taken from the LISA L3 mission proposal5 showing the expected sensitivity (green line) and galactic background (gray area) in units of dimensionless characteristic strain.

The orange solid curve shows the power law injection; each light blue trace shows an individual draw from the posterior; the dashed blue curve marks the median of the power spectrum; and dotted blue lines denote central 90% bounds on the power spectral density at each frequency bin. The results indicate a qualitative recovery of the power spectrum’s overall shape.
Acknowledgement
- This study is carried out at CIERA REU at Northwestern University.
- GZ is supported by Undergraduate Research Committee at Reed College under SOFA.
References
- Amaro-Seoane, P., Audley, H., Babak, S., et al. 2017, arXiv preprint arXiv:1702.00786
- Georgousi, M., Karnesis, N., Korol, V., Pieroni, M., & Stergioulas, N. 2023, Monthly Notices of the Royal Astronomical Society, 519, 2552
- Callister, T. A., & Farr, W. M. 2023, arXiv preprint arXiv:2302.07289
- Banagiri, S., Criswell, A., Kuan, T., et al. 2021, Monthly Notices of the Royal Astronomical Society, 507, 5451
- Robson, T., Cornish, N.J. and Liu, C. 2019, Classical and Quantum Gravity, 36(10), 105011.