Home Page
Research @
Northwestern University
Research @ UW-Madison
Skills Summary
About Me
My Journey

Supermassive Black Hole Binaries:

Bayesian Search for Quasars with Periodicity
in Zwicky Transient Facility

With Dr. Caitlin Witt in Prof. Adam Miller's
Time Domain Research Group @ Northwestern University

Project Background/Intro

As part of the CIERA REU program, I worked in Professor Adam Miller's Time Domain group with Dr. Caitlin Witt (Check out her amazing paper on this topic HERE!) to develop a pipeline which employs Bayesian Statistics to search for Supermassive Black Hole Binaries by identifying Quasars with Periodic Variability.

In simpler words, Supermassive Black Holes, or their Quasar counterparts (The burning hot disk around the Black Hole), are extremely far away from us, and as such are too small to directly image with a telescope. So, to find them, we stare into the cores of galaxies for years at a time. If we notice a consistent, periodic brightening and dimming, we believe this is evidence that we are looking at a Supemassive Black Hole Binary. This periodic brightening and dimming (periodic variability) is a result of a phenomenon of Relativistic Beaming

To find these objects, we use a sampler. We give our sampler two things:

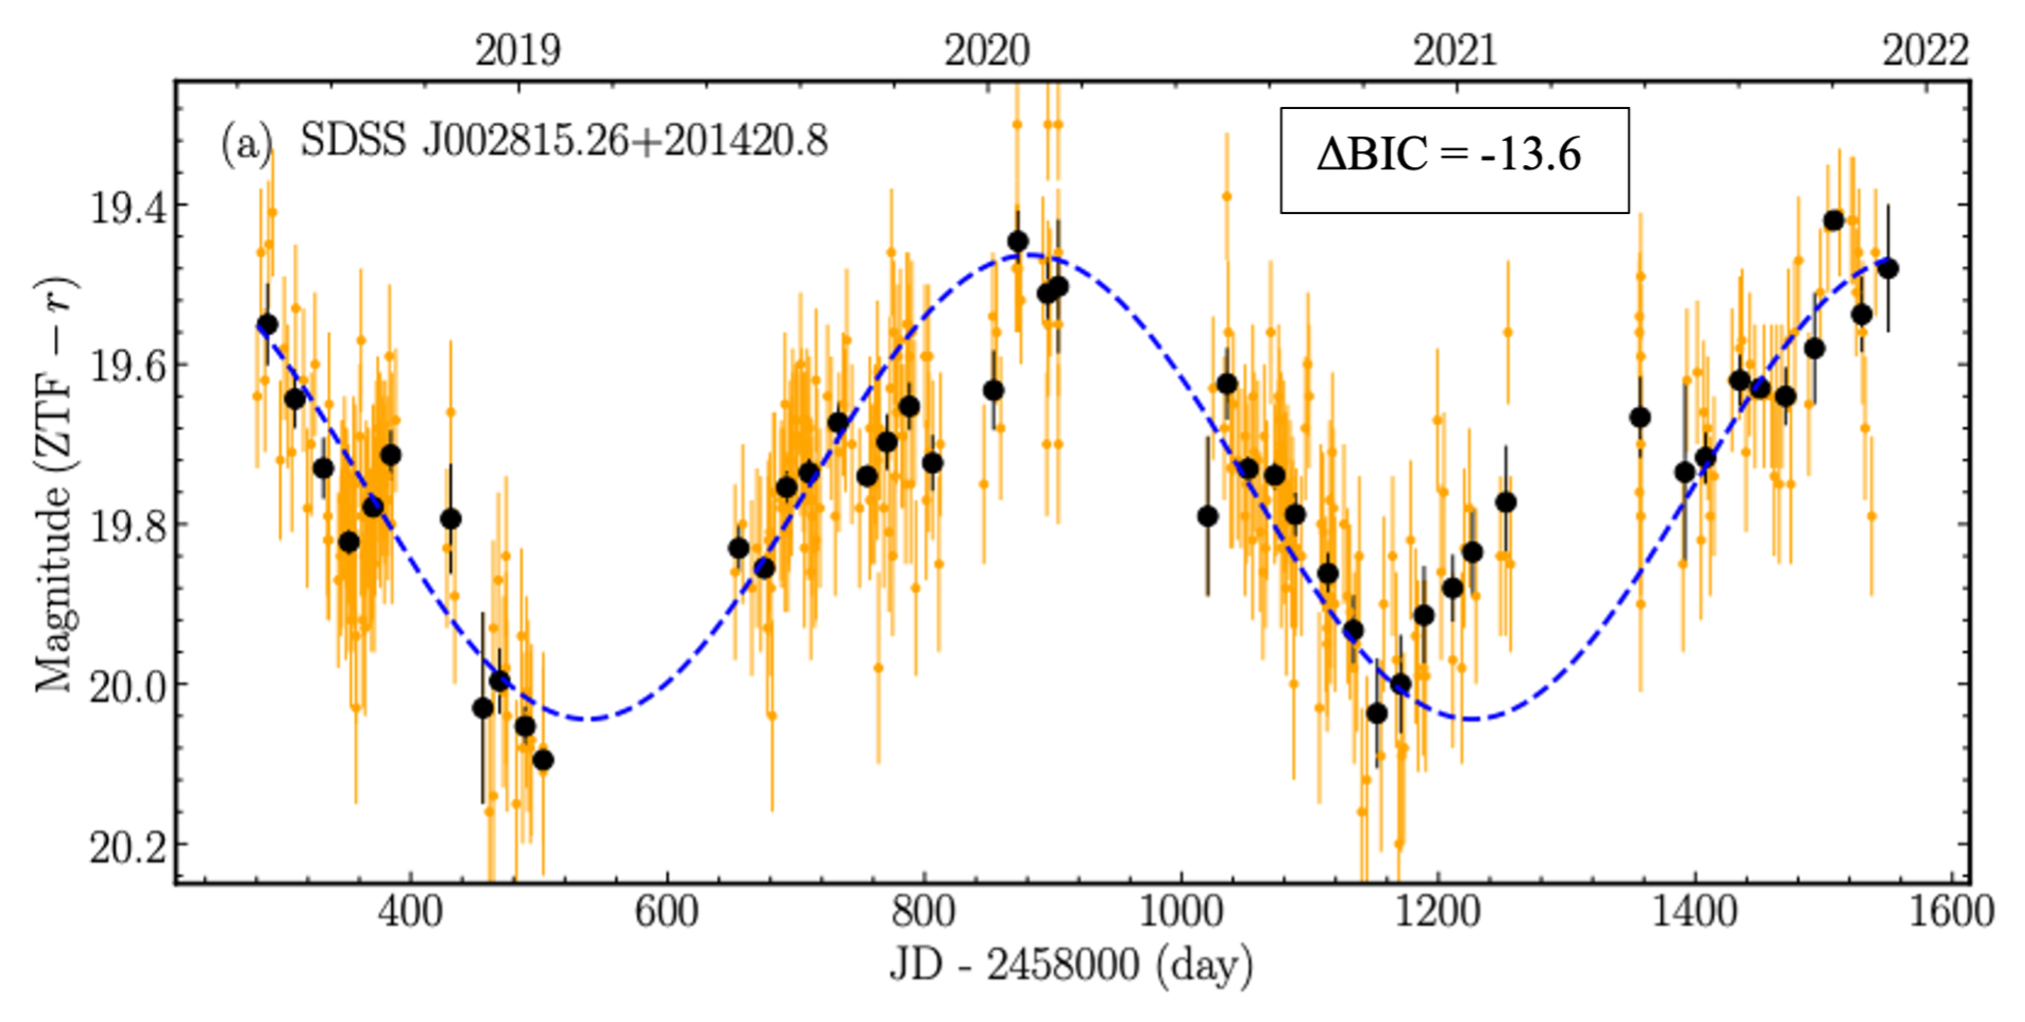
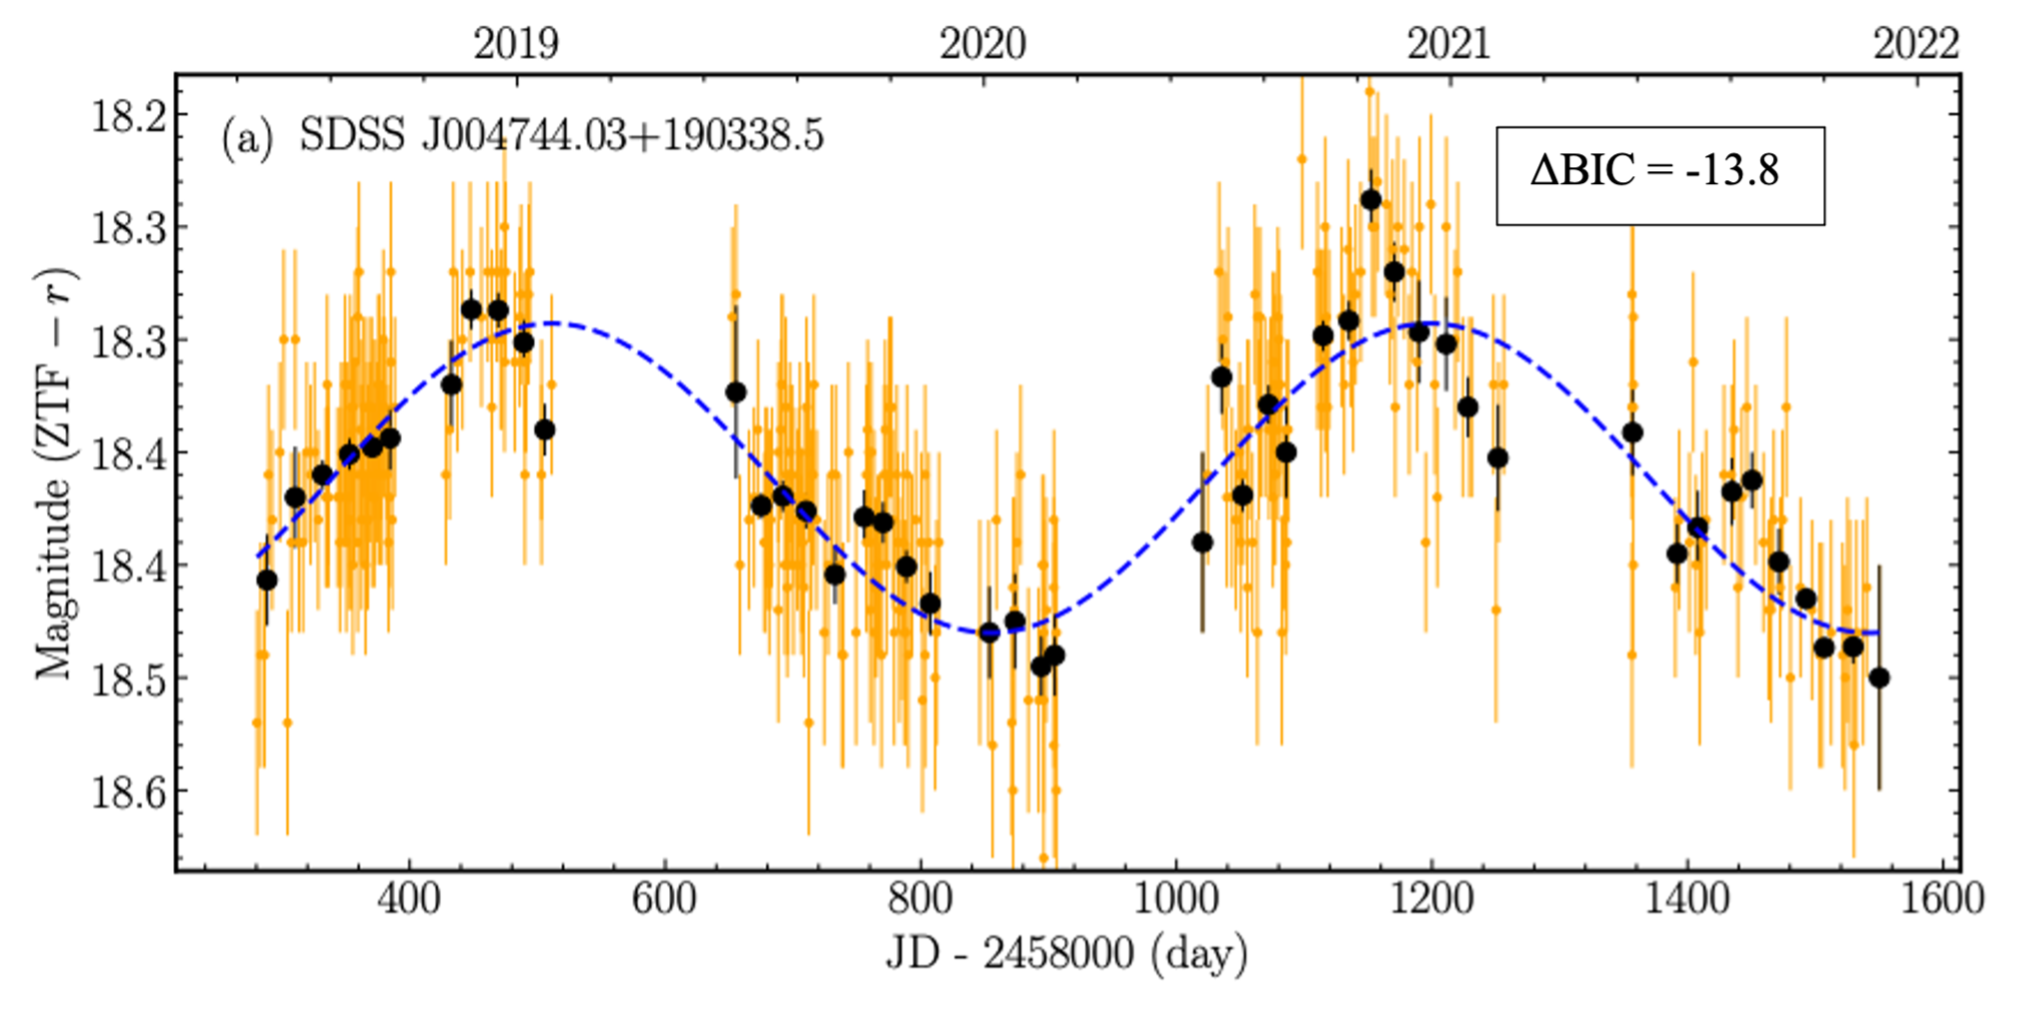
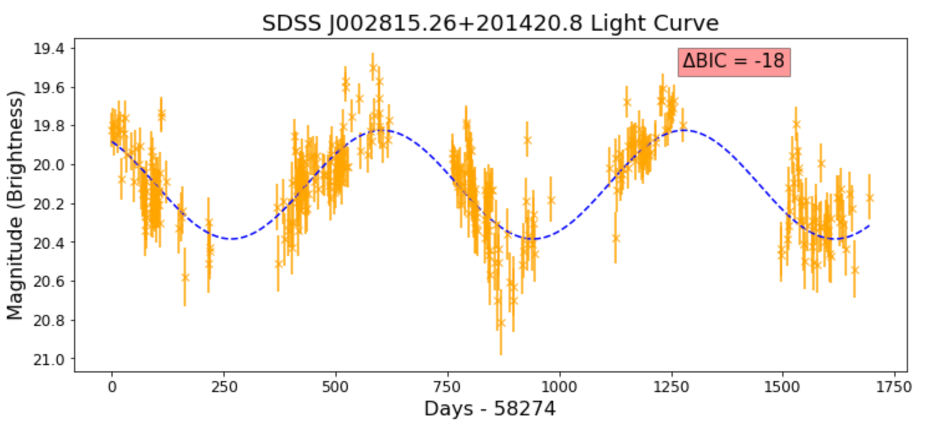
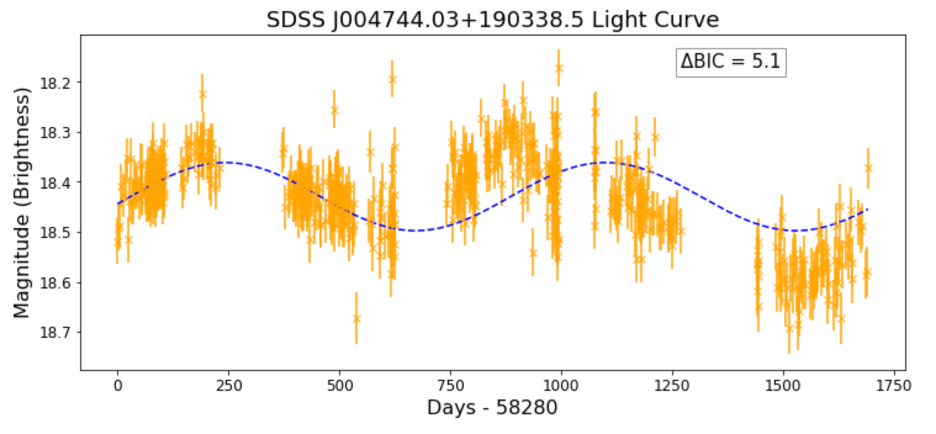
1) A light curve (an object's brightness over time) and
2) Two models which the sampler will try to fit to our light curve.

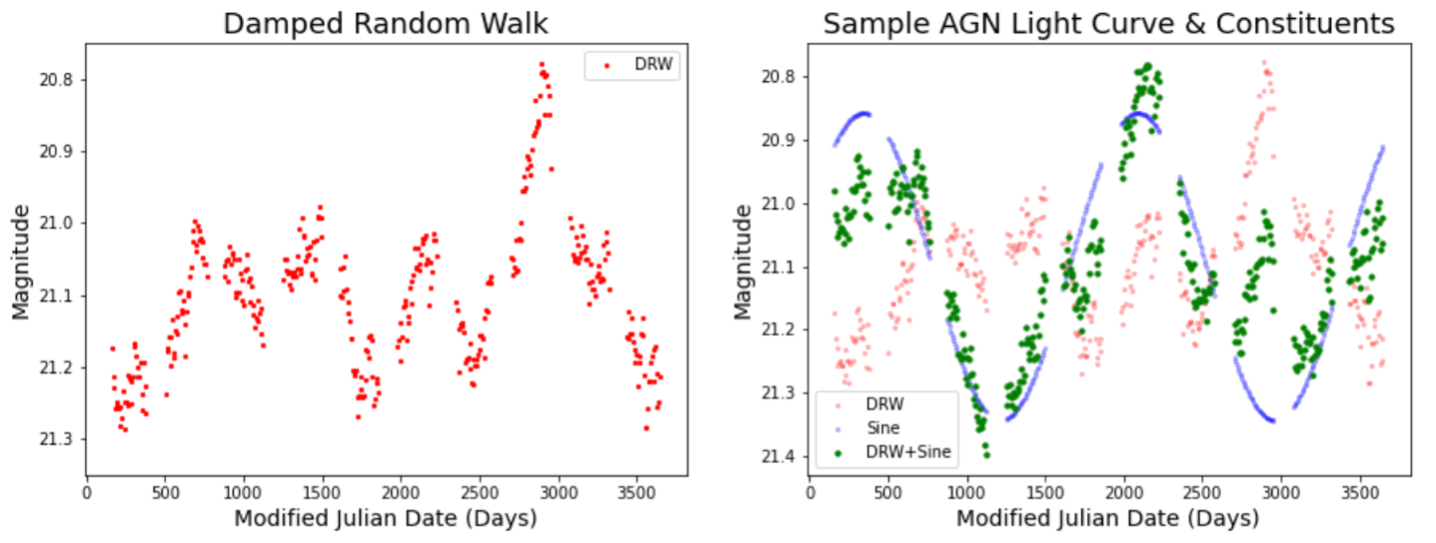
The first model (Left), called a Damped Random Walk, is used to model a singular Supermassive Black Hole light cuve--the brightness over time we'd expect to see from one of these objects. The second model (Right in green) is used to model a Supermassive Black Hole Binary--it uses the previous model, but adds some periodic variability to account for the Relativistic Beaming which happens in the orbit.

The sampler will then give us a number which tells us which model it thinks fits the light curve better--this is called a ΔBIC. If ΔBIC = 0, then the sampler is indifferent--it doesn't prefer either model more than the other. If ΔBIC << 0, however, our sampler strongly believes the light curve we gave it was produced by the second model. That is, it believes the object which produced that light curve is a Supermassive Black Hole Binary!

Getting this ΔBIC rating is the way we confirm whether or not we have found a Supermassive Black Hole Binary. For most of the summer, I have been working on validating the pipeline; that is, making sure the code is working as best as possible.

Thanks to extensive work throughout the final week of the program, we have validated the pipeline to our standards, and in the past couple days, we have begun applying the pipeline to real light curve data and embarked on our journey through the universe to find Supermassive Black Hole Binaries!

Results (So far!)

In a previous paper (Chen et al.) a group created a model similar to the pipeline we've created, and published a sample of 127 objects which their model predicts are periodic quasars, or Supermassive Black Hole Binaries.

Below are 4 light curve plots (brightness over time) of 2 objects, SDSSJ002815.26+201420.8 and SDSSJ004744.03+190338.5. The first two plots are the light curves and analyses performed on these objects by the Chen et al. and the second two plots are analyses we have performed on these objects with our pipeline. We and the Chen et al. group use different samplers (emcee vs. ultranest) and our analysis includes an additional ~year of data.


Plots of two objects' light curves (Brightness over time). Blue data points are observations from the Zwicky Transient Facility. Dashed black line is the underlying periodic signal which our pipeline believes it found. The ΔBIC tells us how strongly the pipeline believes this light curve was generated by a Supermassive Black Hole Binary. Due to the small ΔBIC of -18 << -10, our pipeline has strong evidence that object SDSS J002815.26+201420.8 is a Supermassive Black Hole Binary

While these results are interesting, in order to interpret them with full context, we need to apply the pipeline to many light curves. The SDSS J002815.26+201420.8 object with a strong ΔBIC may be a very unique occurrence or a common finding with our pipeline. We'll be moving forwarrd, applying the pipeline to even more light curves to get some answers soon. Any new results will be posted here!

What I've Learned

This program has been one of the best opportunities I have ever participated in. From the incredible leadership from my advisor Dr. Caitlin Witt, to the plethora of coding workshops, to the presentation and networking opportunities, the CIERA REU has equipped me with all the tools I need to make a decision on my future and succeed in whatever I choose.

Though I have worked with python for a little over a year now, my work this summer has helped me improve my coding skills by orders of magnitude. I've become intimately familiar with command line and have spent weeks working with Quest, a High Performance Computing Cluster, in order to handle massive data sets. I've improved my ability to simulate and interpret data with new packages and visualizations in python. Most notably, I worked with Bayesian Statistics in the form of the ultranest package Reactive Nested Sampler and have plotted myriad results with the matplotlib library--a researchers favorite tool.

More important than experience with any specific package, however, I have gained priceless experience in using my creativity to analyze and experiment with pre-existing code and to problem-solve through any adversity this brings. Working with Bayesian Statistics code which analyzes Supermassive Black Hole Quasar Light Curves with a Postdoc who works with NANOGrav is such a unique and niche opportunity which I have been fortunate to earn, however the experience I've gained will help me no matter what I choose to pursue in the future.

Acknowledgements

This material is based upon work supported by the National Science Foundation under grant No. AST 2149425, a Research Experiences for Undergraduates (REU) grant awarded to CIERA at Northwestern University. Any opinions, findings, and conclusions or recommendations expressed in this material a re those of the author(s) and do not necessarily reflect the views of the National Science Foundation. This research was supported in part through the computational resources and staff contributions provided for the Quest high performance computing facility at Northwestern University which is jointly supported by the Office of the Provost, the Office for Research, and Northwestern University Information Technology.
Background Image Credit: James Webb Space Telescope