Simulating the Reflected-light Brightness of an Exoplanet as a Function of Phase
Mentors: Dr. Sarah Blunt and Dr. Jason Wang @ Northwestern CIERA
Overview
Exoplanets are one of the most promising areas of research in astrophysics. With the Nancy Roman Grace Telescope (NGRT) launching in 2027,
there is a demand to conduct numerical experiments that show scientists what they can expect to see as it collects data. Taking images of
exoplanets in visible light is one of Roman’s missions, making this a significant moment in astronomy research, as we are currently only
able to image exoplanets in infrared light. Using the high-level programming language Python, we conducted a simulation to model the brightness
variation of reflected visible light over the course of its orbit. The brightness simulation is an addition to an existing python package called
“orbitize!”(Blunt citation), that specializes in helping users model orbits of directly-imaged exoplanets. Users will be able to incorporate brightness
measurements into their orbit-fits, thus allowing us to better constrain the orbital parameters. The results of these simulations will not only aid with
the interpretation of Roman data, but will also help us connect how the knowledge of exoplanets' brightness can help our understanding of other orbital
parameters. By having this refined knowledge of orbital parameters, we are then able to better understand exoplanets characteristics, such as composition and size.
Simulations
Orbitize! is a python package that allows users to conduct orbit fitting simulations, based on directly imaged exoplanets or simulated data sets (Blunt citation). This means that given a data set of a certain planet, orbitize will return a plot of all of the possible orbital positions over a specified time interval. The simulation discussed in this paper is an additional function that orbitize will run. The levels of reflected visible light from an exoplanet can be modeled through a simulation that requires data input from users. This data is planet exclusive and includes right ascension, declination, and brightness values and will return posteriors over different orbital parameters such as eccentricity, inclination, semi-major axis, parallax, and time. After all of the necessary equations (derived from a Lambertain Disk model) were were written into the orbitize package to plot the brightness of the planet over different epochs during its orbit. First we added a new parameter that is required to carry out the equations above, the true anomaly, f, into Orbitize’s Kepler file, where the code solves for the orbit of the planet given Keplerian parameters. We then called upon that new parameter in the main system file, where the lambertain disk equations were written in, to produce a final brightness result.
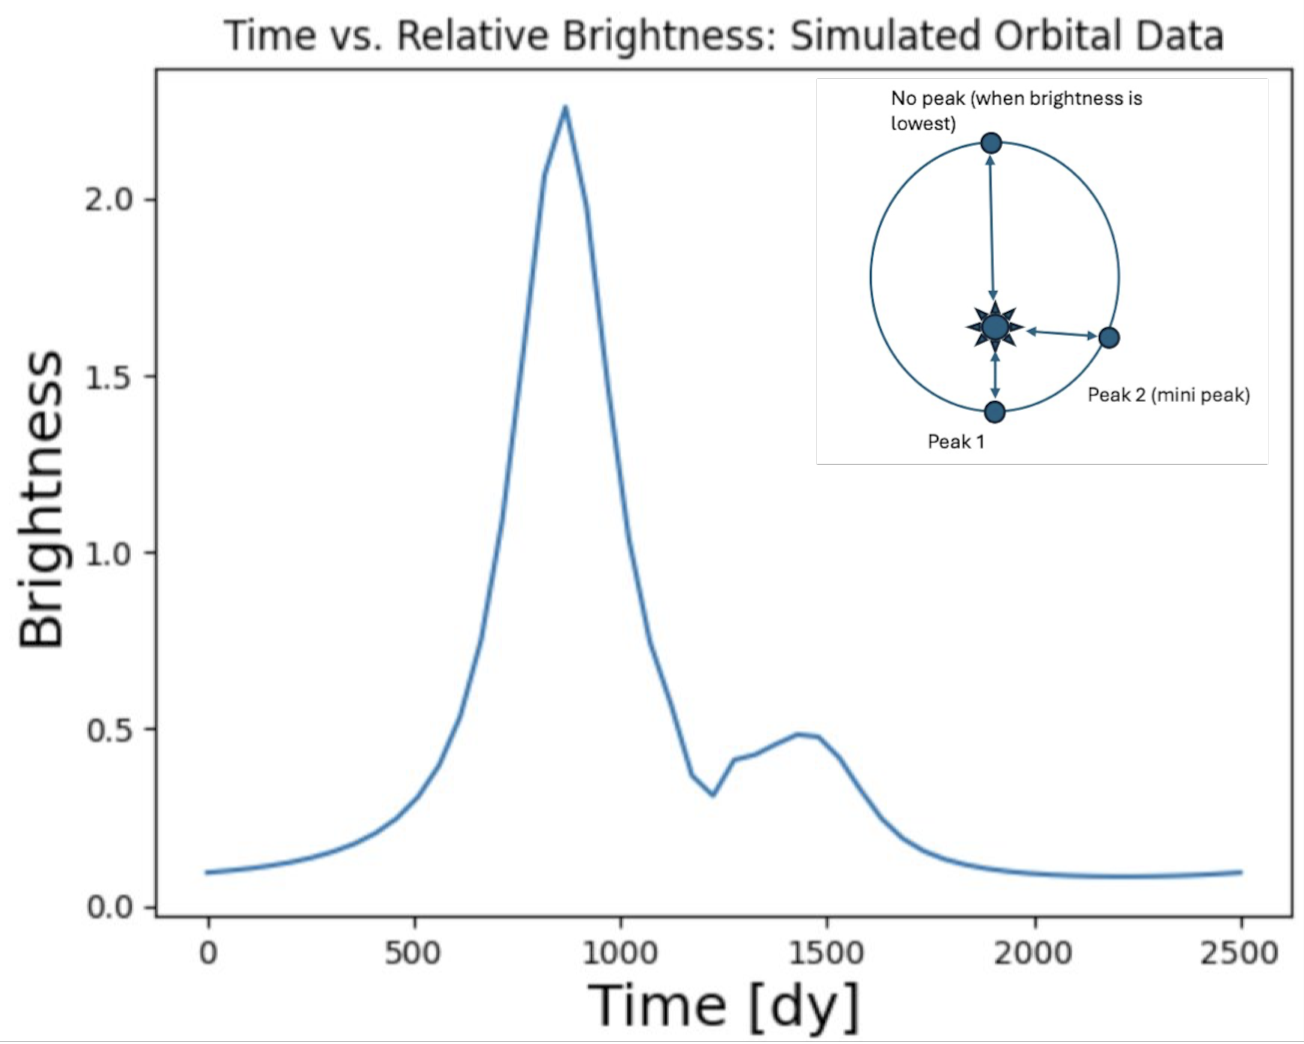
Figure 1: Simulated relative brightness of an exoplanet over the course of its orbit. The upper corner plot shows where the planet is in its orbit in relation to the peaks on the plot. It's important to note the second, smaller peak that happened due to the orbital path having an eccentricity of 0.3, therefore creating a second epoch where the brightness slightly rises again.
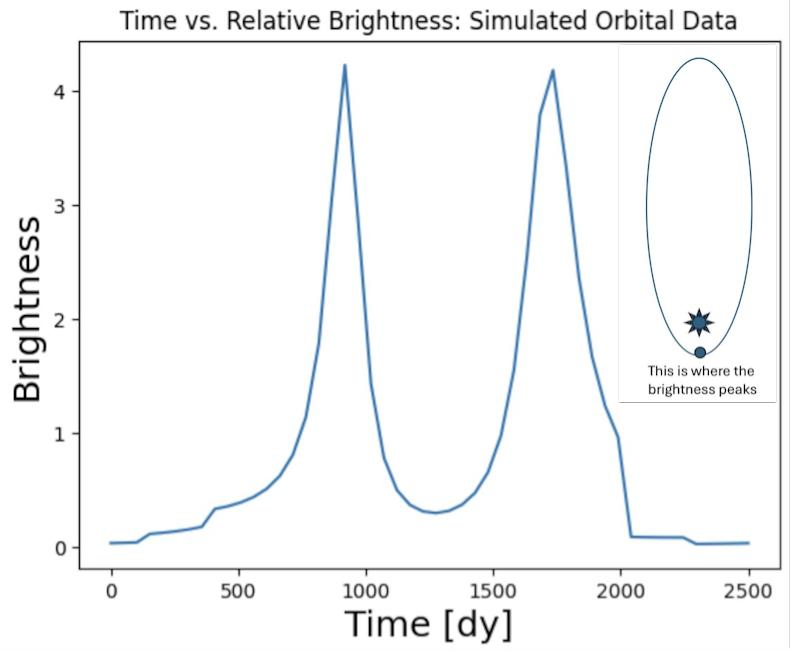
Figure 2: This is the relative brightness of an exoplanet over the course of its orbit based on simulated data. This plot has the same data inputs as fig.1, with the exception of a higher eccentricity value at 0.9. The second peak is much higher than in fig.1; this demonstrates how orbital parameters can influence the shapes of the brightness curves.
What do these results mean?
After implementing the equations into orbitize’s code, we plotted brightness vs time for different combinations of orbital parameters to explore how a planet's orbit affects its brightness throughout its orbital period. Fig. 1 shows the relative brightness for an orbital path that sits at a 30 degree inclination, is 0.9 AU from its star, and has an eccentricity of 0.3. In fig. 2, while all the other orbital parameters remained the same, the eccentricity was changed to 0.9. By comparing the two figures we are able to see how changing the orbital parameters can change the curve; once we raise the eccentricity value, we see the second peak of brightness also grows. With a more eccentric orbit, we can expect that there is only one epoch at which the planet will be closest to its star, and therefore the brightest, so why are we seeing two peaks? We came to the conclusion that it’s at these points where the planet is passing into and out of the plane of the sky. This accounts for the brightness levels being identical, but having that small window of time in between, where the brightness dims to almost 0.
Once data is fed into the system, Orbitize users can expect posteriors over orbital parameters. It does this by using the code (see simulations section) to construct a model, then fitting that to the data. While this new addition to Orbitize will allow users to see brightness levels fitted against its orbital path, it will also help us understand how the different parameters have various influences over the brightness. Once we have a refined knowledge of this connection, we can then think about implementing more complex reflection-laws, allowing us to simultaneously model a planet's orbit and its physical characteristics, such as size and composition. This research also provides a glimpse of the type of data we will see when the NGRT launches, making it easier to interpret its data.What's next?
In future work we plan to fully integrate the code into orbitize, so that it will be available to users upon the next version release. There is also more to be done in terms of fully exploring the parameter space on brightness vs. orbital parameters. For example, we could investigate how the argument of periastron affects the brightness curve in addition to eccentricity. And lastly, this project will be useful when the time comes to interpret real data from the NGRT after its launch in 2027.
Acknowledgements
-
F.M. would like to thank all members of the BOBA research group and peers for their support and providing feedback.
This material is based upon work supported by the National Science Foundation under Grant No. AST2149425, a Research
Experience for Undergraduates (REU) grant awarded to CIERA at Northwestern University. Any opinions, findings, and
conclusions or recommendations expressed in this material are those of the author(s) and do not necessarily reflect
the views of the National Science Foundation.