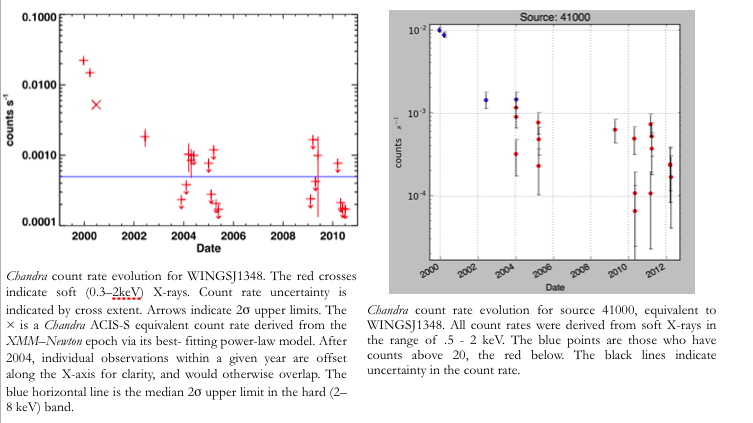
Checking for variability
We first took in data from a pre-composed database that included the x-ray flux for each source found in each Chandra observation of a galaxy cluster.
Then, for each source in a given cluster...- Converted the total flux in the soft (0.5 keV to 2 keV) x-ray band to counts per second by multiplying by the effective area of the detector and the duration of the observation
- Off-axis effects were included. Our database did not include the axis position, so we estimated the distance using the 85% encircled energy radius. Source with radii greater than 20” were removed because they fell outside our fit
- Excluded sources that were greater than 6.67’ away from the center of the observation because they were found to include too much background, leading to count rates up to several orders of magnitude greater than reality
- Performed a least-squares fit to compare the count rate over time to the average count rate; points with poor fits (2 > 50) were determined to be sufficiently variable and recorded
- Checked Chandra observations to remove false positives, then classified each source with SIMBAD. Objects that had no SIMBAD classification were categorized visually