Methods
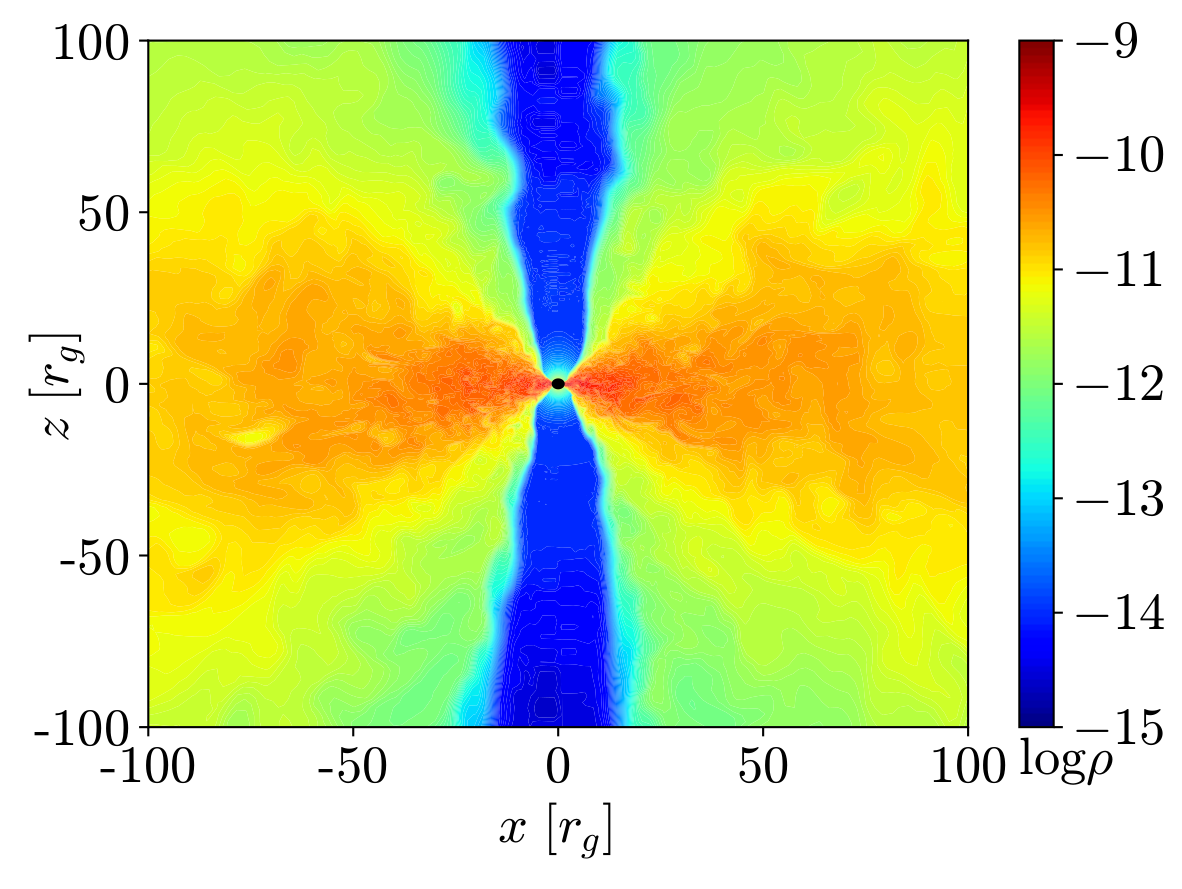
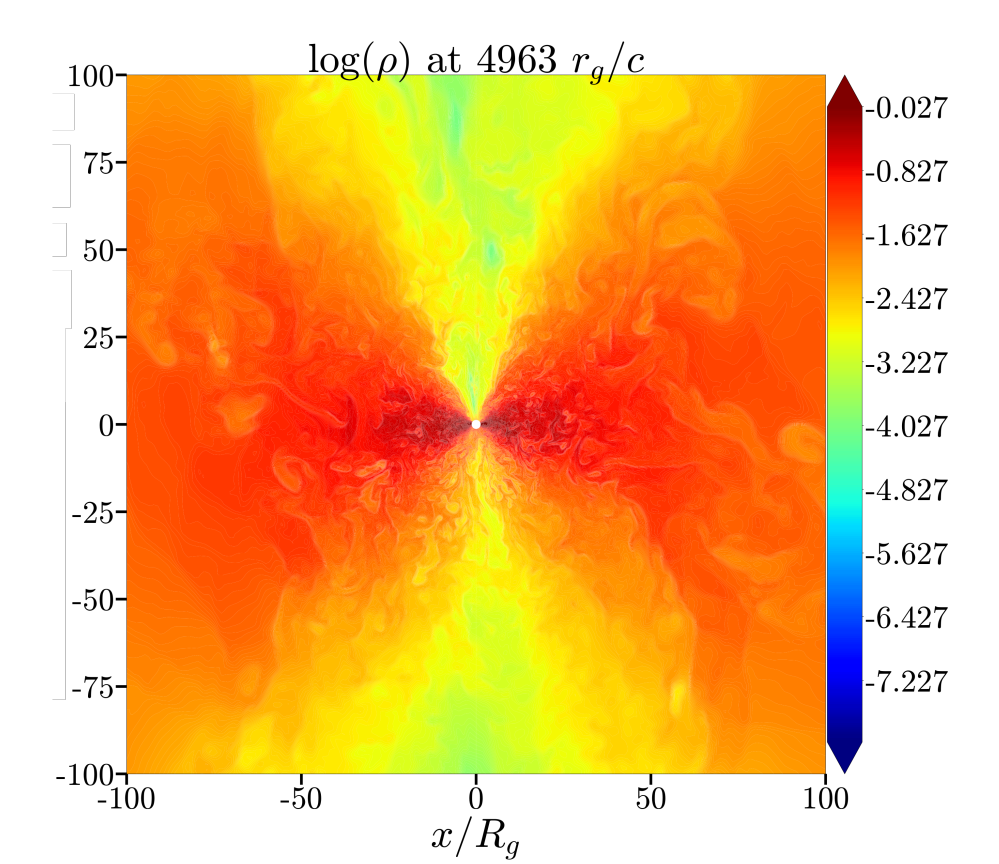
Simulations were performed using HARMPI (https://github.com/atchekho/harmpi) an enhancement of HARM (Gammie et al. 2003; Noble et al. 2006). HARM is a 2D GRMHD scheme for modelling systems with relativistic gravitational fields and strong electromagnetic fields. Enhancements in the code have made it fully functional with 3D systems and accounted for several physical processes such as neutrino cooling and recombination (Fernndez et al. 2019). Three simulations were run with differences only in the initial strength and orientation of the magnetic field within the torus. These fields were a strong poloidal magnetic field (BPS), a weak poloidal magnetic field (BPW), and a toroidal magnetic field (BT). All simulations started with a black hole mass of 3 M and a torus mass of 0.033 M . The initial spin parameter, a dimensionless measure of black hole spin, was a=0.8. The constant initial electron fraction, Y e = 0.1. Simulations were run out to a maximum time of 4-9 seconds (3 − 6)x10 5 rg, where rg = GM bh /c 2 is the gravitational radius and c is the speed of light. Video of the GRB simulation may be seen here and a summary of results can be seen in Christie et al. (2019). An additional simulation was run to compare different initial conditions of toroidal magnetic fields. This simulation did not include neutrino cooling and recombination. Thus, the initial black hole mass and torus mass are free parameters. The initial spin parameter was a=0.9, and Y e = 0.5. The system initially had a toroidal magnetic field (BTAGN). Video of the AGN simulation can be seen here and a summary of results can be seen in Liska et al. (2018). We differentiate the two BT simulations with GRB and AGN as the first was simulating a neutron star merger which creates a gamma ray burst (GRB) and the second was simulating an active galactic nuclei (AGN). Below you can see a typical density plot for each run after the jets are formed.