Results
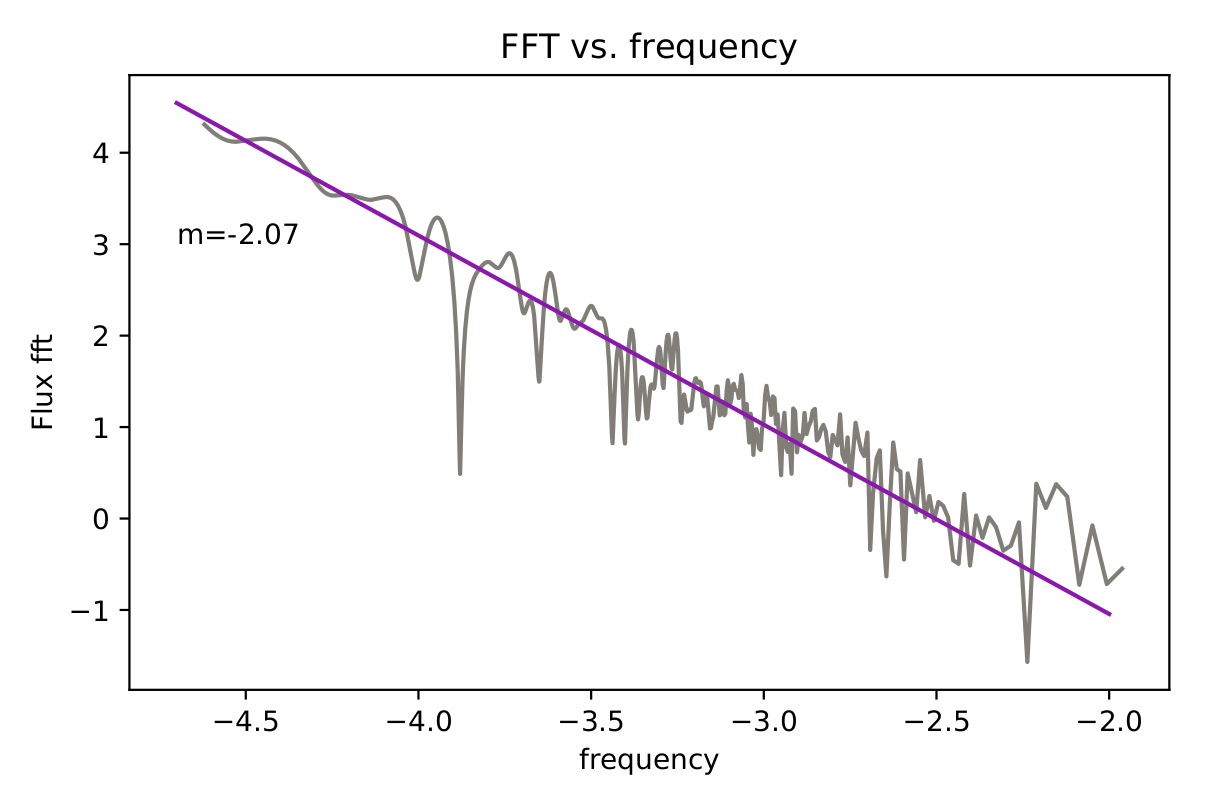
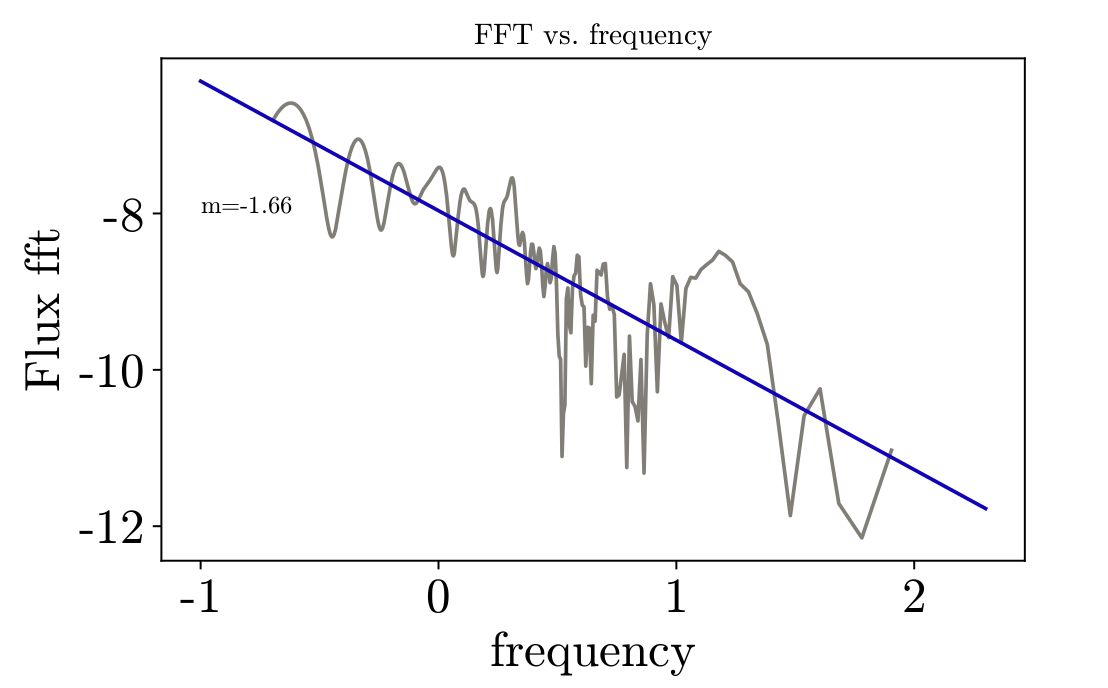
In figures 1 and 2 you can see the power spectral density (PSD) of the magnetic flux on the black hole for the AGN and GRB runs respectively. The PSD was calculated by taking the fourier transform of the magnetic flux. Fourier transforms require uniformly spaced time intervals to calculate. The AGN run did have uniformly spaced time data, however, the GRB run did not. To allow the PSD to be calculated, one dimensional, linear interpolation was performed. This gave magnetic flux as a function of time, with evenly spaced time intervals between the data. Overlayed on the PSD is best fit line of the data.
Discussion
Giannios & Uzdensky (2019) say that for systems which show flips in magnetic flux, the slope of the PSD will be -1.67. For our GRB system, which shows flips in magnetic flux, we found the slope to be -1.66, which agrees with the proposed value within the margin of error. For the AGN system, which did not show magnetic field flips, the slope was found to be -2.07. This difference in slopes could be due to the lack of flips seen in magnetic flux for the AGN simulation. Since the power law is equivalent to the distribution of field reversal time scales, it follows that if the field reversal timescale doesn’t exist, then the slope would not be as expected. In the future, we hope to do similar analysis on simulations with finer time resolution and determine if there are errors introduced when interpolating from data which is unevenly spaced in time to data which is evenly spaced in time. Additionally, we are currently investigating the physics of turbulent processes which lead to jet formation by calculating the kinetic helicity of the magnetic flux loops within the torus. We will also investigate the movement of magnetic flux over time by creating a butterfly diagram.