| WELCOME | WHY EMRIs? | METHODS | DISCUSSION AND CONCLUSION | REFERENCES AND THANKS |
Naomi Shechter's site for CIERA!
METHODS
The Process of Harmonic Correlation:
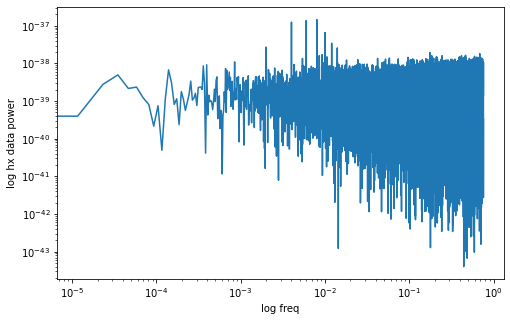
We began by simulating the orbit of an EMRI, from which we created a gravitational wave signal, or waveform (see the EMRIs page to view the waveforms of h+ and hx).We then applied a Fast Fourier Transform to the resulting values of polarization amplitudes h+ and hx converting our data into the frequency domain (4). This is an important step, which will allow us to extract information about the crucial periodic structures which would indicate the presence of a waveform. Preceding the harmonic correlation, we prepared our data by determining the power at each frequency.

Then, for each frequency, we multiplied it’s power by the power of higher harmonics; this is the harmonic correlation.
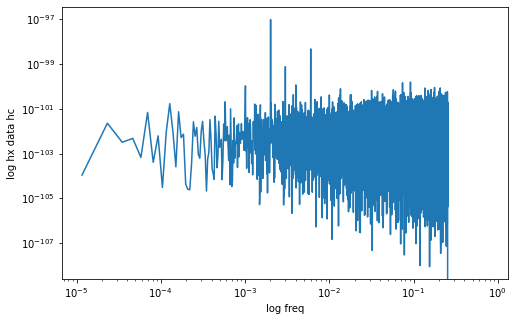
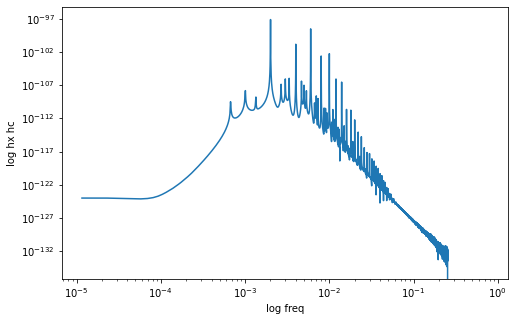
By employing this method, frequencies with a higher power at later harmonics were amplified, while frequencies which didn’t demonstrate a structure throughout the power spectrum were reduced. Once all simulations were correct, we simulated Gaussian noise and added this to our signal to produce realistic LISA data. Running the full data through our harmonic correlation (left) yielded a graph which, when compared with the HC of our signal alone (right), has an indicative spike at the same value of x.

