| WELCOME | WHY EMRIs? | METHODS | DISCUSSION AND CONCLUSION | REFERENCES AND THANKS |
Naomi Shechter's site for CIERA!
DISCUSSION + CONCLUSION
Discussion and Conclusion
Comparing the harmonic correlation of the data to the signal alone demonstrates how well
this method is able to dampen noise, even at low SNR. Not only does the large spike indicate a signal in the noise, it also
lets us know the frequency range to search, making the process of analyzing EMRI data much more efficient. Additionally,
while harmonic correlation is first and foremost used for detection, it does allow us to determine parameters such as the
period of the orbit and possibly the eccentricity. Altogether, this method will expedite and enrich our understanding of EMRIs,
as well as the systems those objects reside in.
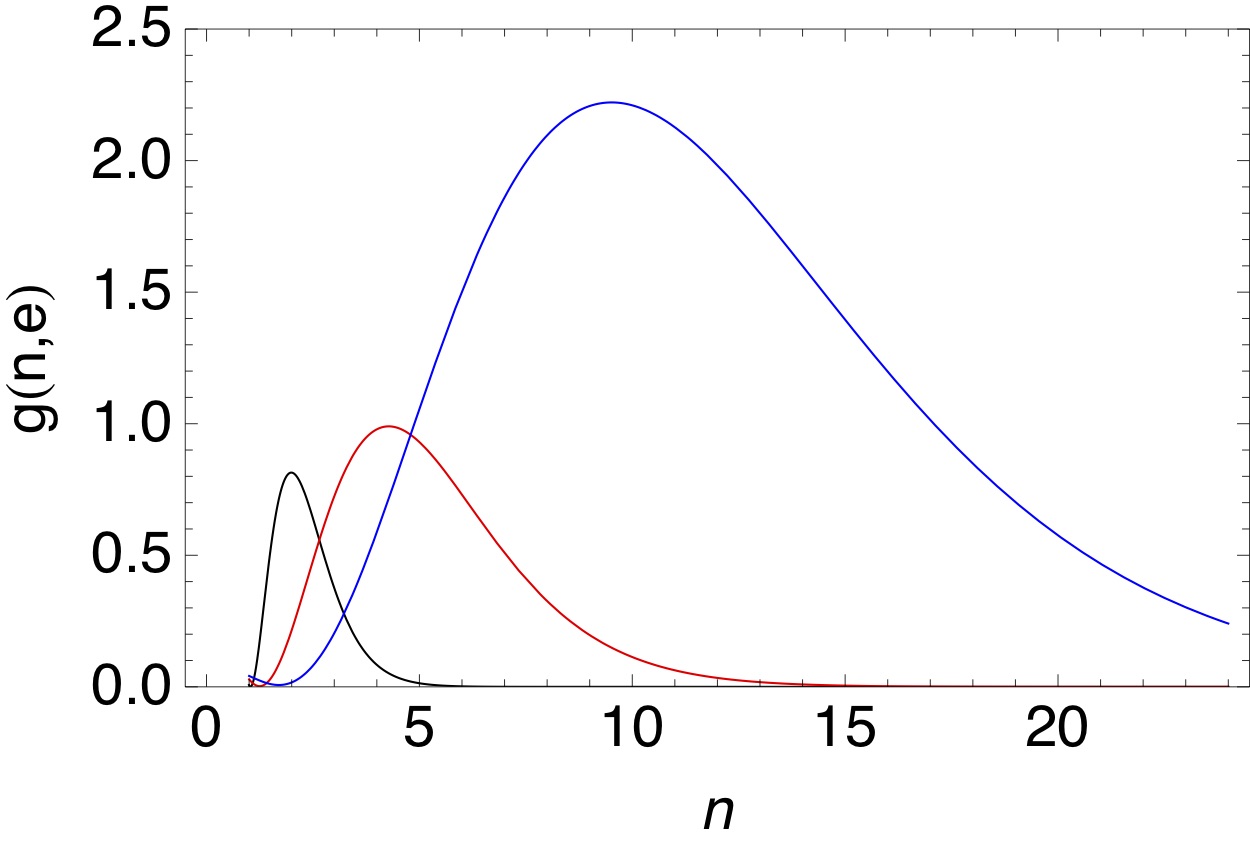
That being said, there are pitfalls to be aware of. Consider this P&M harmonic structure graph, with imaginary lines drawn from the x axis to the top of the curve
representing harmonics, and their height representing values of power.

Depending on the eccentricity of the orbit, sampling too many harmonics for that value (and therefore multiplying by smaller and smaller powers) can diminish the indicative spike in frequency. The solution is to limit the number of harmonics considered during the correlation. At the same time, a value of eccentricity which is too high will spread the power over more harmonics, flattening the envelope and leading to an extremely low SNR. While these cases should be considered, harmonic correlation remains an effective tool for a vast range of EMRI parameters, and a promising method for analyzing LISA data.