The effects of Parameters and Theory of the Two Particle System
Once we determined that our code was simulating the collisions correctly, we looked at the effects of the apportioning of energy on the order parameter, the effects of dissipation on the order parameter, the effects of angle of incidence on the order parameter, and the effects of the number of particles on the order parameter. The error bars on each graph are found using the statistical standard deviation. The standard deviations are present as the order parameter was calculated only at the times of the collisions. There is also uncertainty due to the fact that the order parameter is found as an average over time.
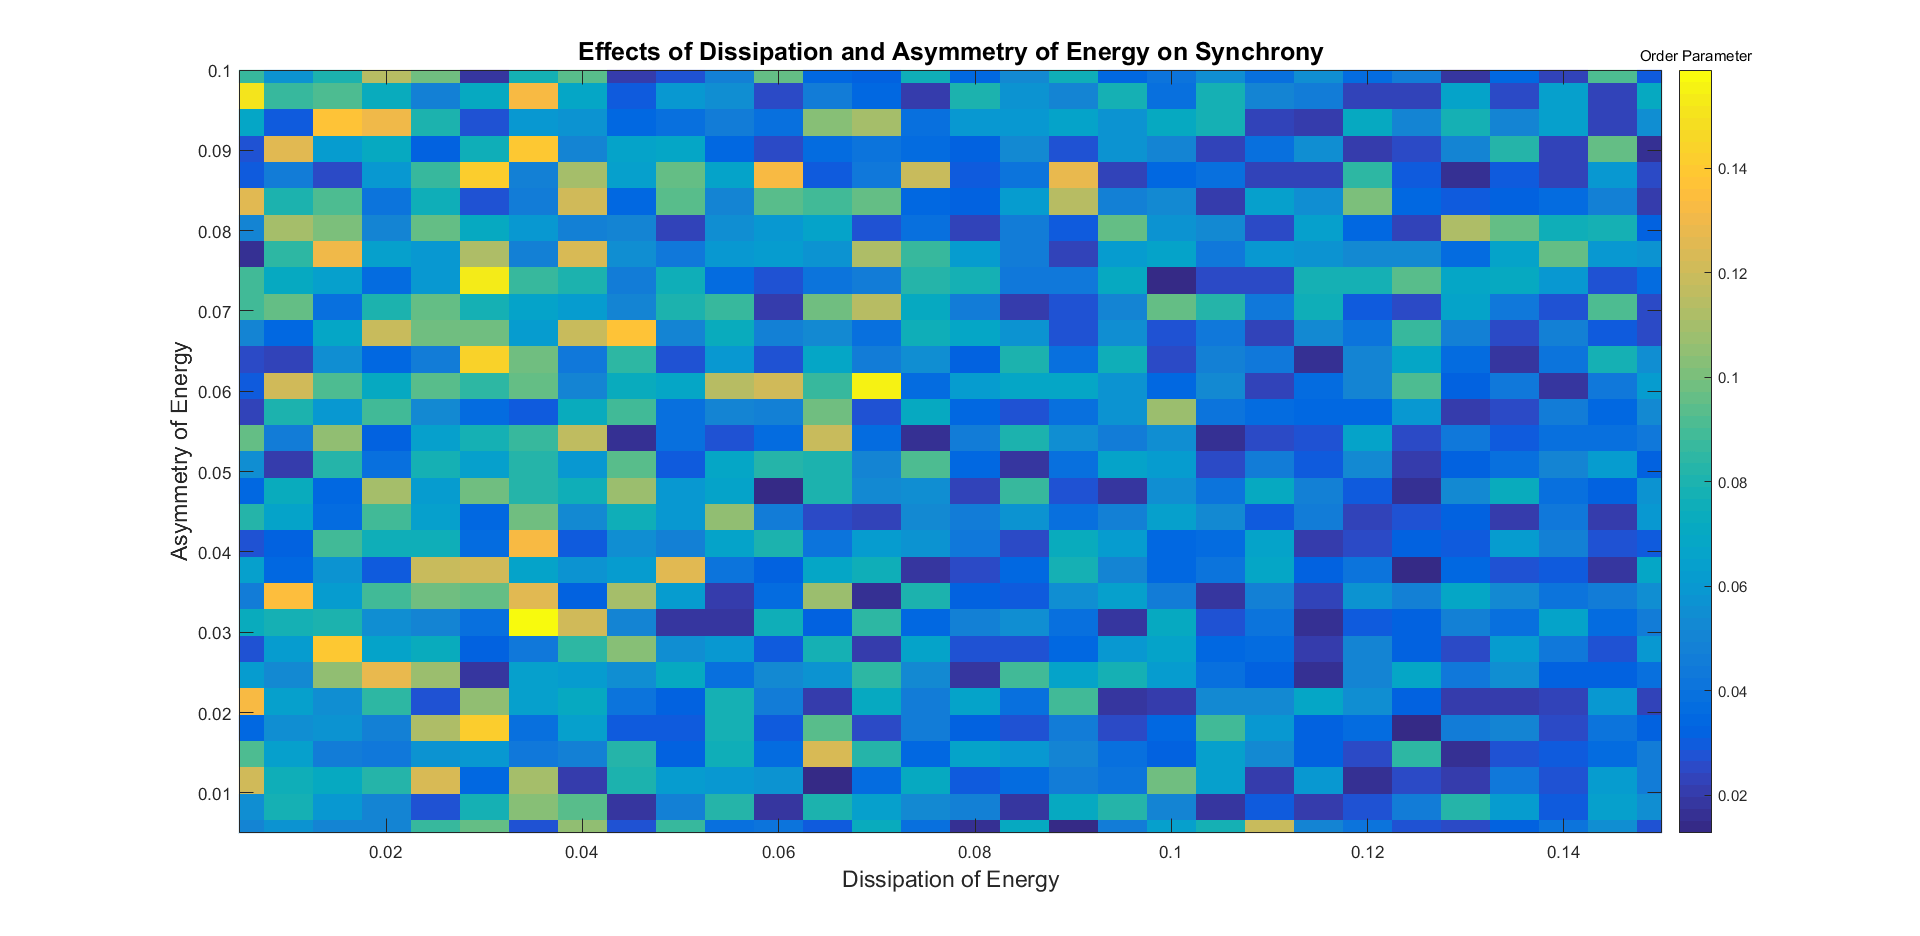
When analyzing the effects of the parameters, we perceived a strong effect present on the order parameter due to changes in dissipation and apportioning of energy. Instead of examining these individually, we examined the coinciding effect on the order parameter by making a two dimensional grid color plot. We saw the greatest order present when the dissipation of energy is small. We use these values as constants for the rest of the parameters studied because we know that these produce high synchrony.
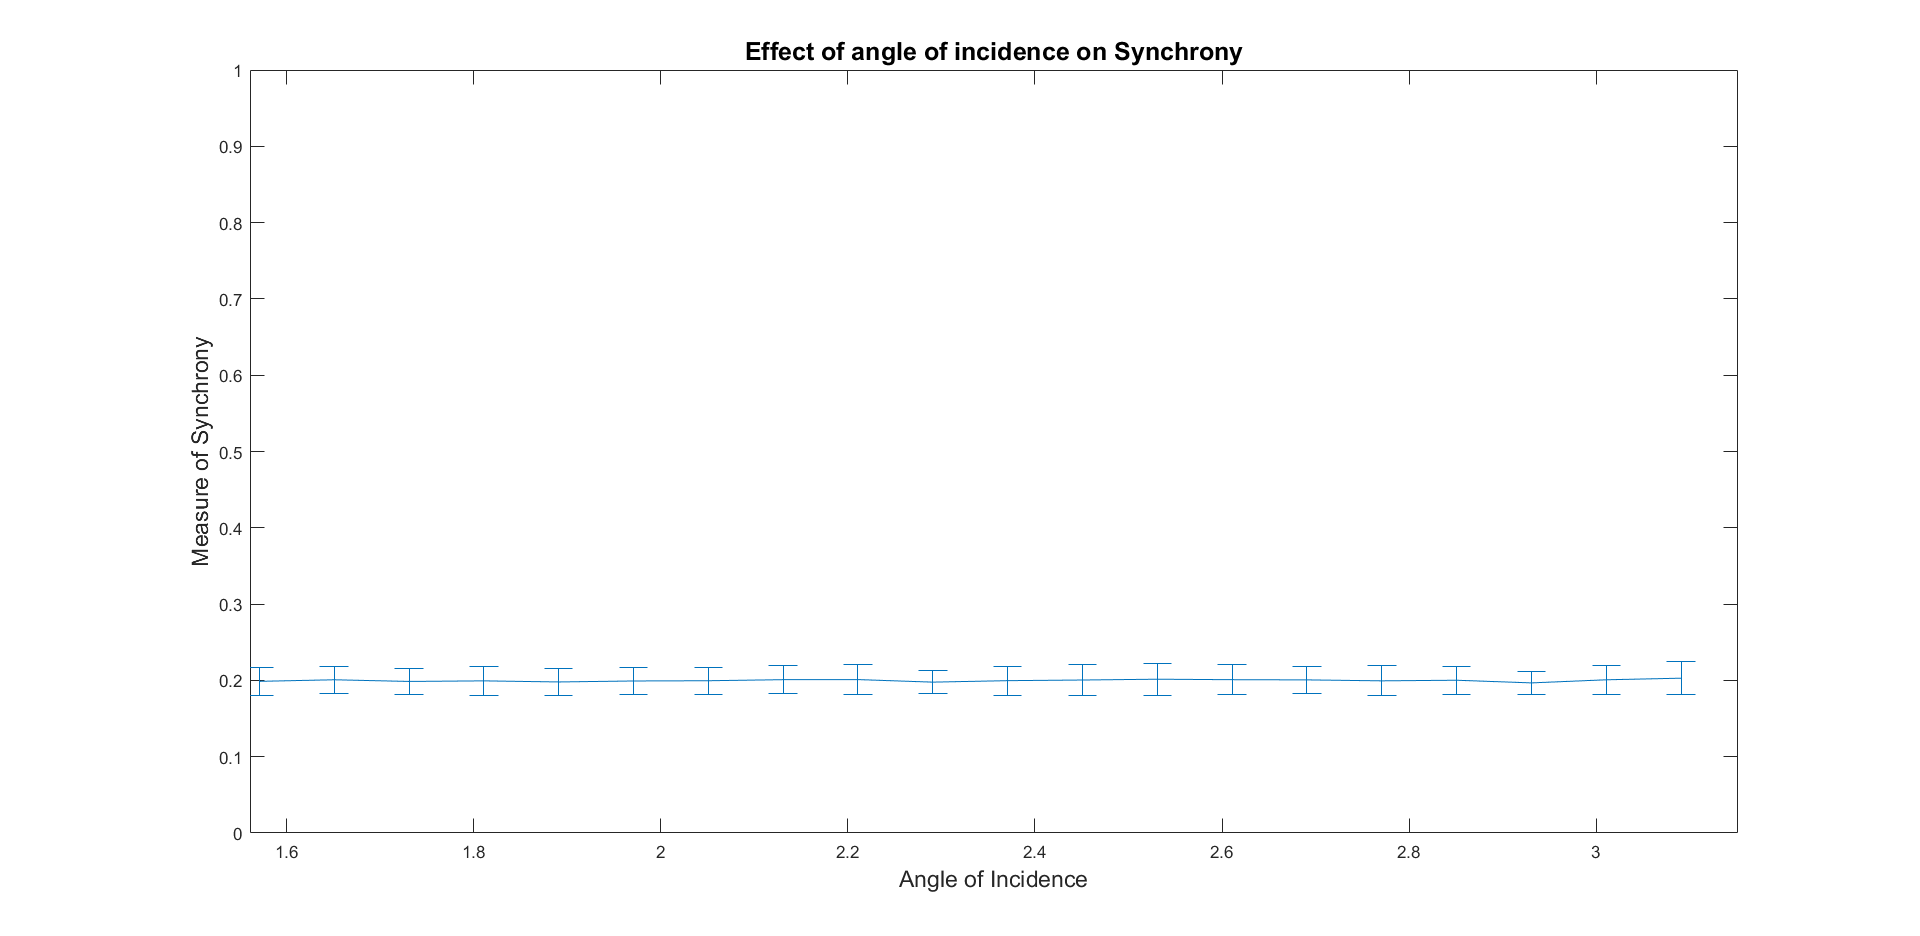
The effects the angle of the incident velocity of particle j does not appear to have any effect on the order parameter. Because the energy is divided between the two particles by the apportioning of energy, the angle at which they collide does not affect the energy substantially. We set the angle of incidence to be a constant.
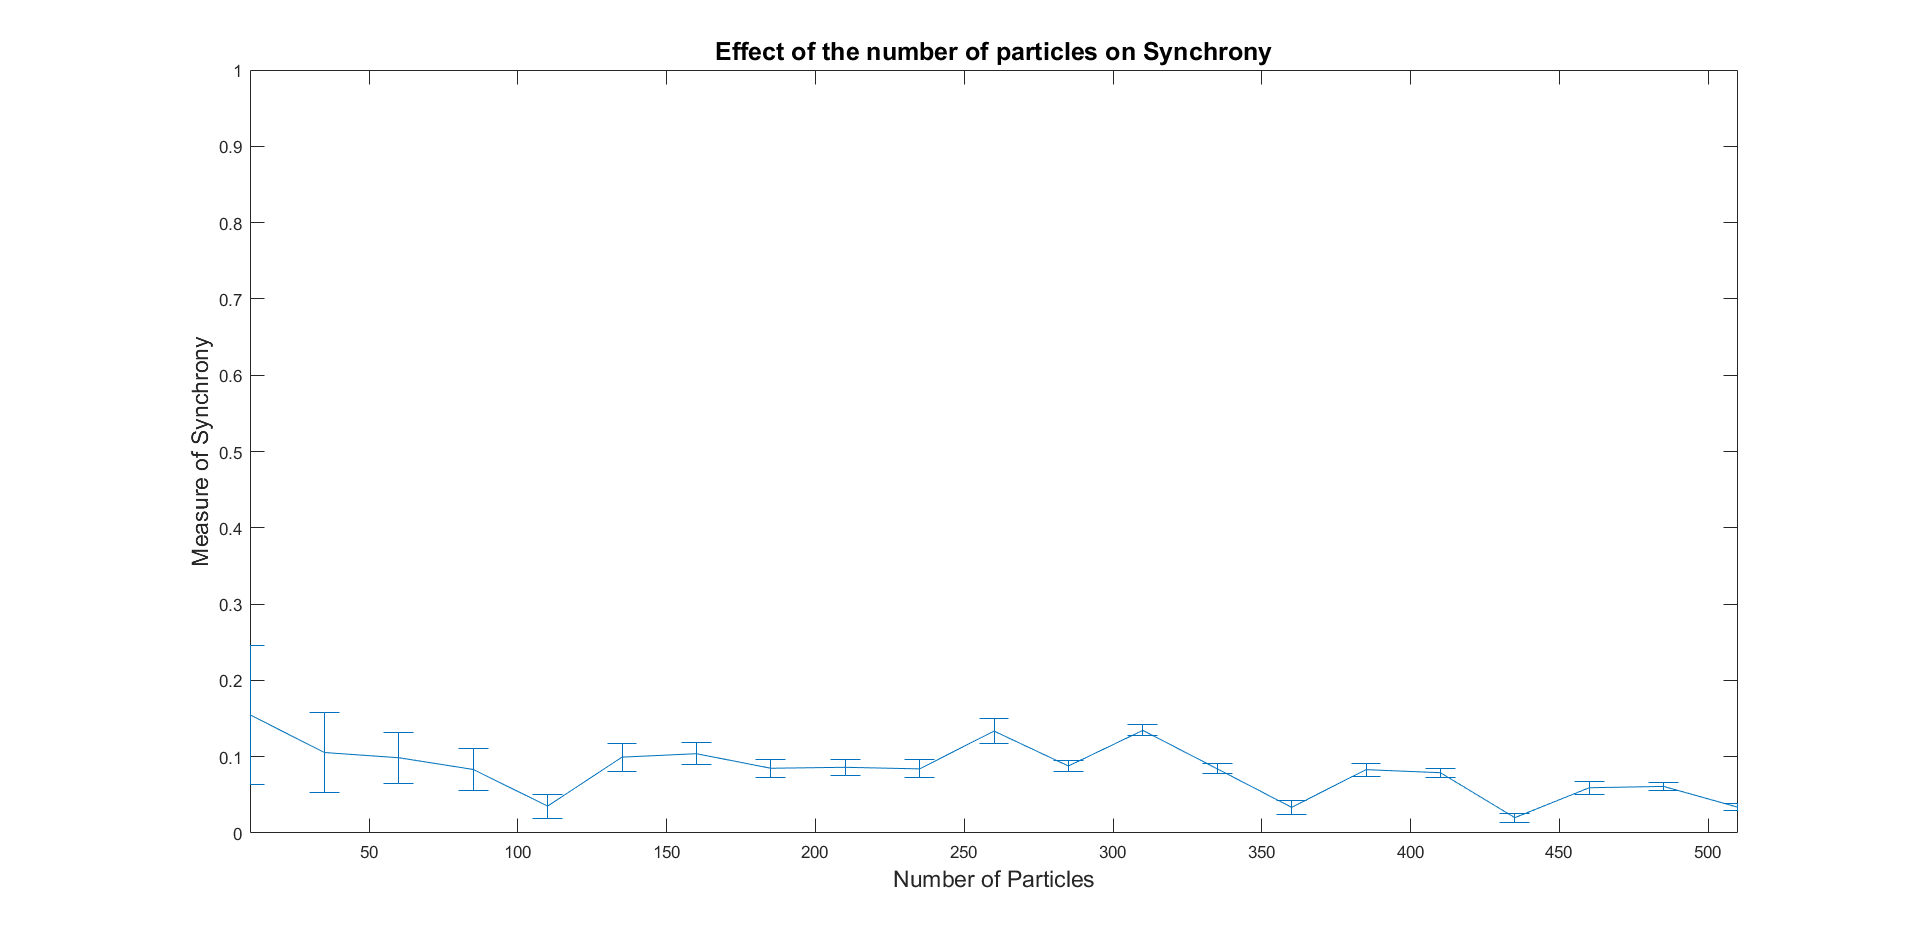
The number of particles in our simulated systems also has the potential to affect the synchrony present in the system. If there are fewer particles, collisions will be less frequent. Therefore, the more particles, the more collisions possible in the time allotted in our simulation. When examining the effects of the number of particles on synchrony, we saw an an increase in the order parameter as the number of particles increased, but a smaller increase than expected. Therefore, the number of particles in our simulated system do not significantly affect the synchrony of the system.
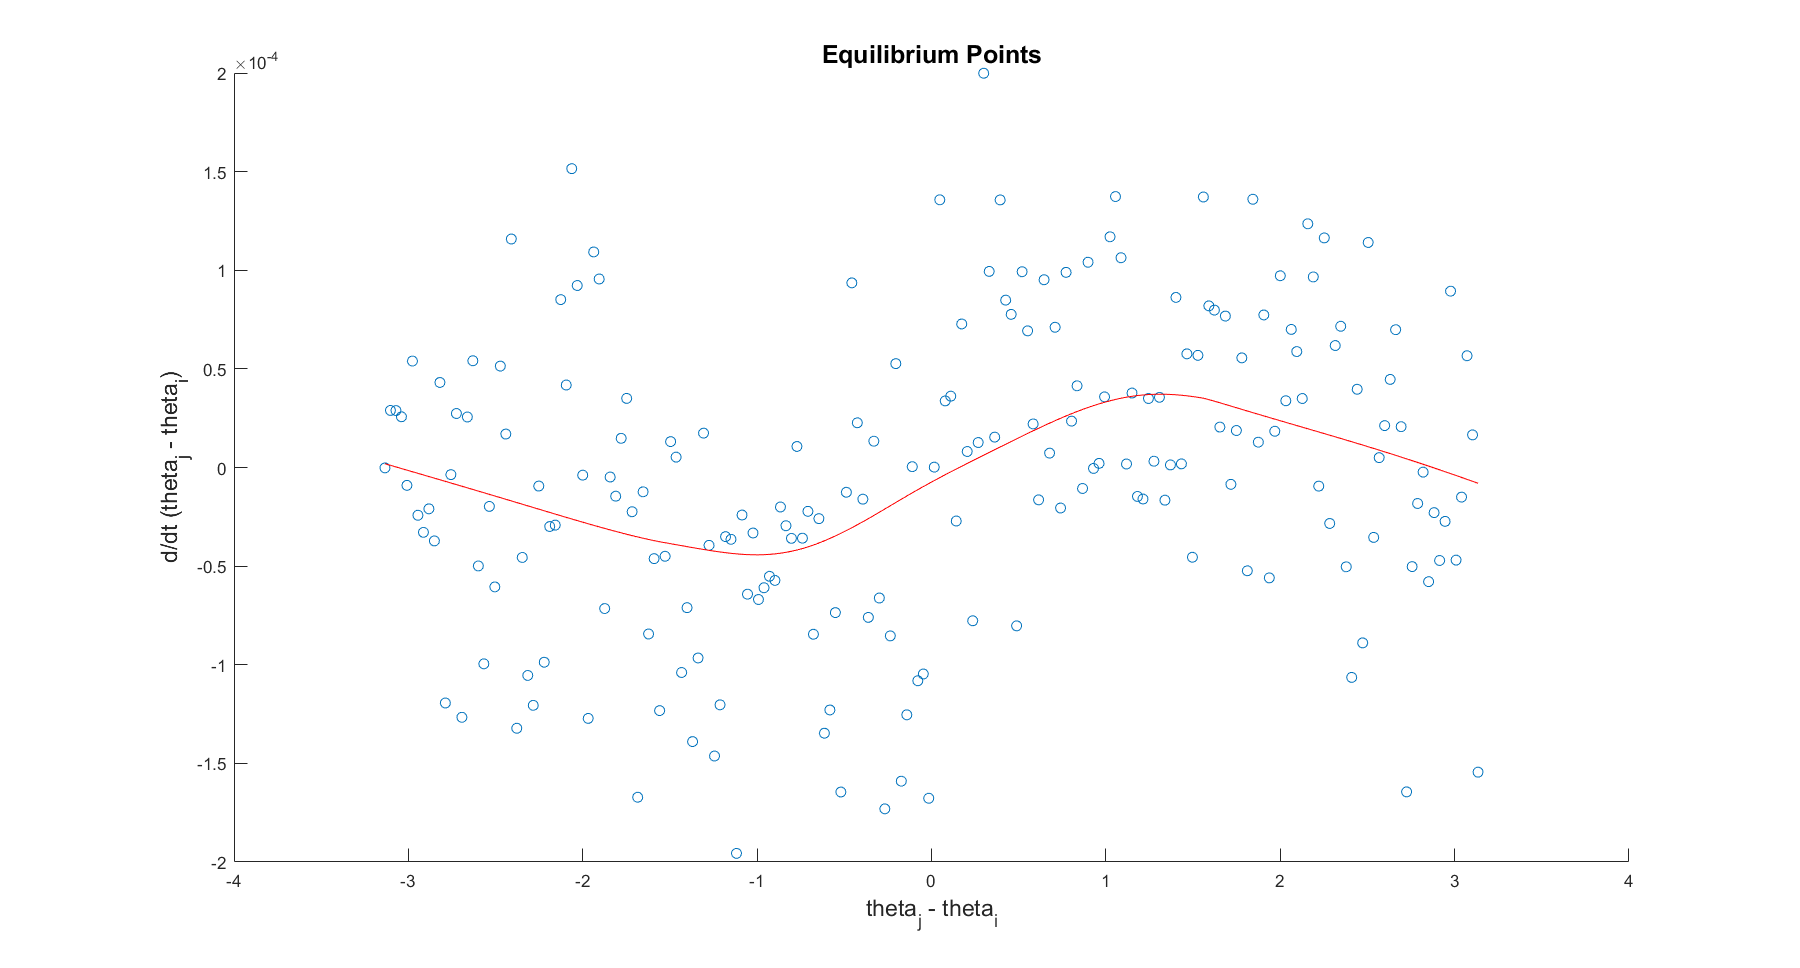
After examining parameters, we decided to consider the simplest system: two orbiting particles. We examine the simplest system with the hopes that the simple system will give us more intuition regarding the connection to the Kuramoto model. When running the simulation to a sufficient amount of time, we saw that the two particles continued to collide; the particles were not inclined to end on the exact same radius. Ending on the same radius would require the particles to have the same frequency, which would necessitate the particles to never collide in the future. Because this was not the case, we decided to examine if there are any steady states possible. When using the Kuramoto model, plotting the derivative in phase of the oscillators against the difference in phase, we can see a sinusoid graph. This indicates steady states at the points at which the derivative is equal to zero, with two stable and two unstable fixed points. Examining the fixed points of a system is informative for our system because the location of these fixed points will tell us where equilibrium in the system might be. The equilibrium in the system indicate that synchrony or asynchrony is present in the system for a long substantial amount of time. Our two particle simulation producing some fixed points would indicate a possibility of our many particle simulation producing fixed points. Following this model, we find the phase difference and the derivative of the phase. We find the average of the values of the derivative for each bin within the phase. This ensures that we see a smooth curve.